🚀 Bitcoin Price Surge: Is $120K Imminent This Week?

Bitcoin bulls are charging—again. After weeks of consolidation, BTC's price action hints at a potential breakout that could send shockwaves through traditional markets.
The $120K question
All eyes are on the $120,000 resistance level as on-chain data shows whales accumulating at current prices. The last time this pattern emerged, Bitcoin rallied 40% in two weeks.
Liquidity game
Market makers appear to be positioning for volatility, with Deribit's options skew showing heavy call buying at the $120K strike. Meanwhile, Wall Street analysts—who predicted $30K would be 'unsustainable'—are quietly revising their models.
Could this be the final pump before the halving? Or just another case of crypto markets doing exactly what retail least expects? Either way, your traditional portfolio manager still thinks it's 'just a speculative asset'—right before their client asks about BTC allocation.
BTC Price Analysis: Technicals
By Shayan
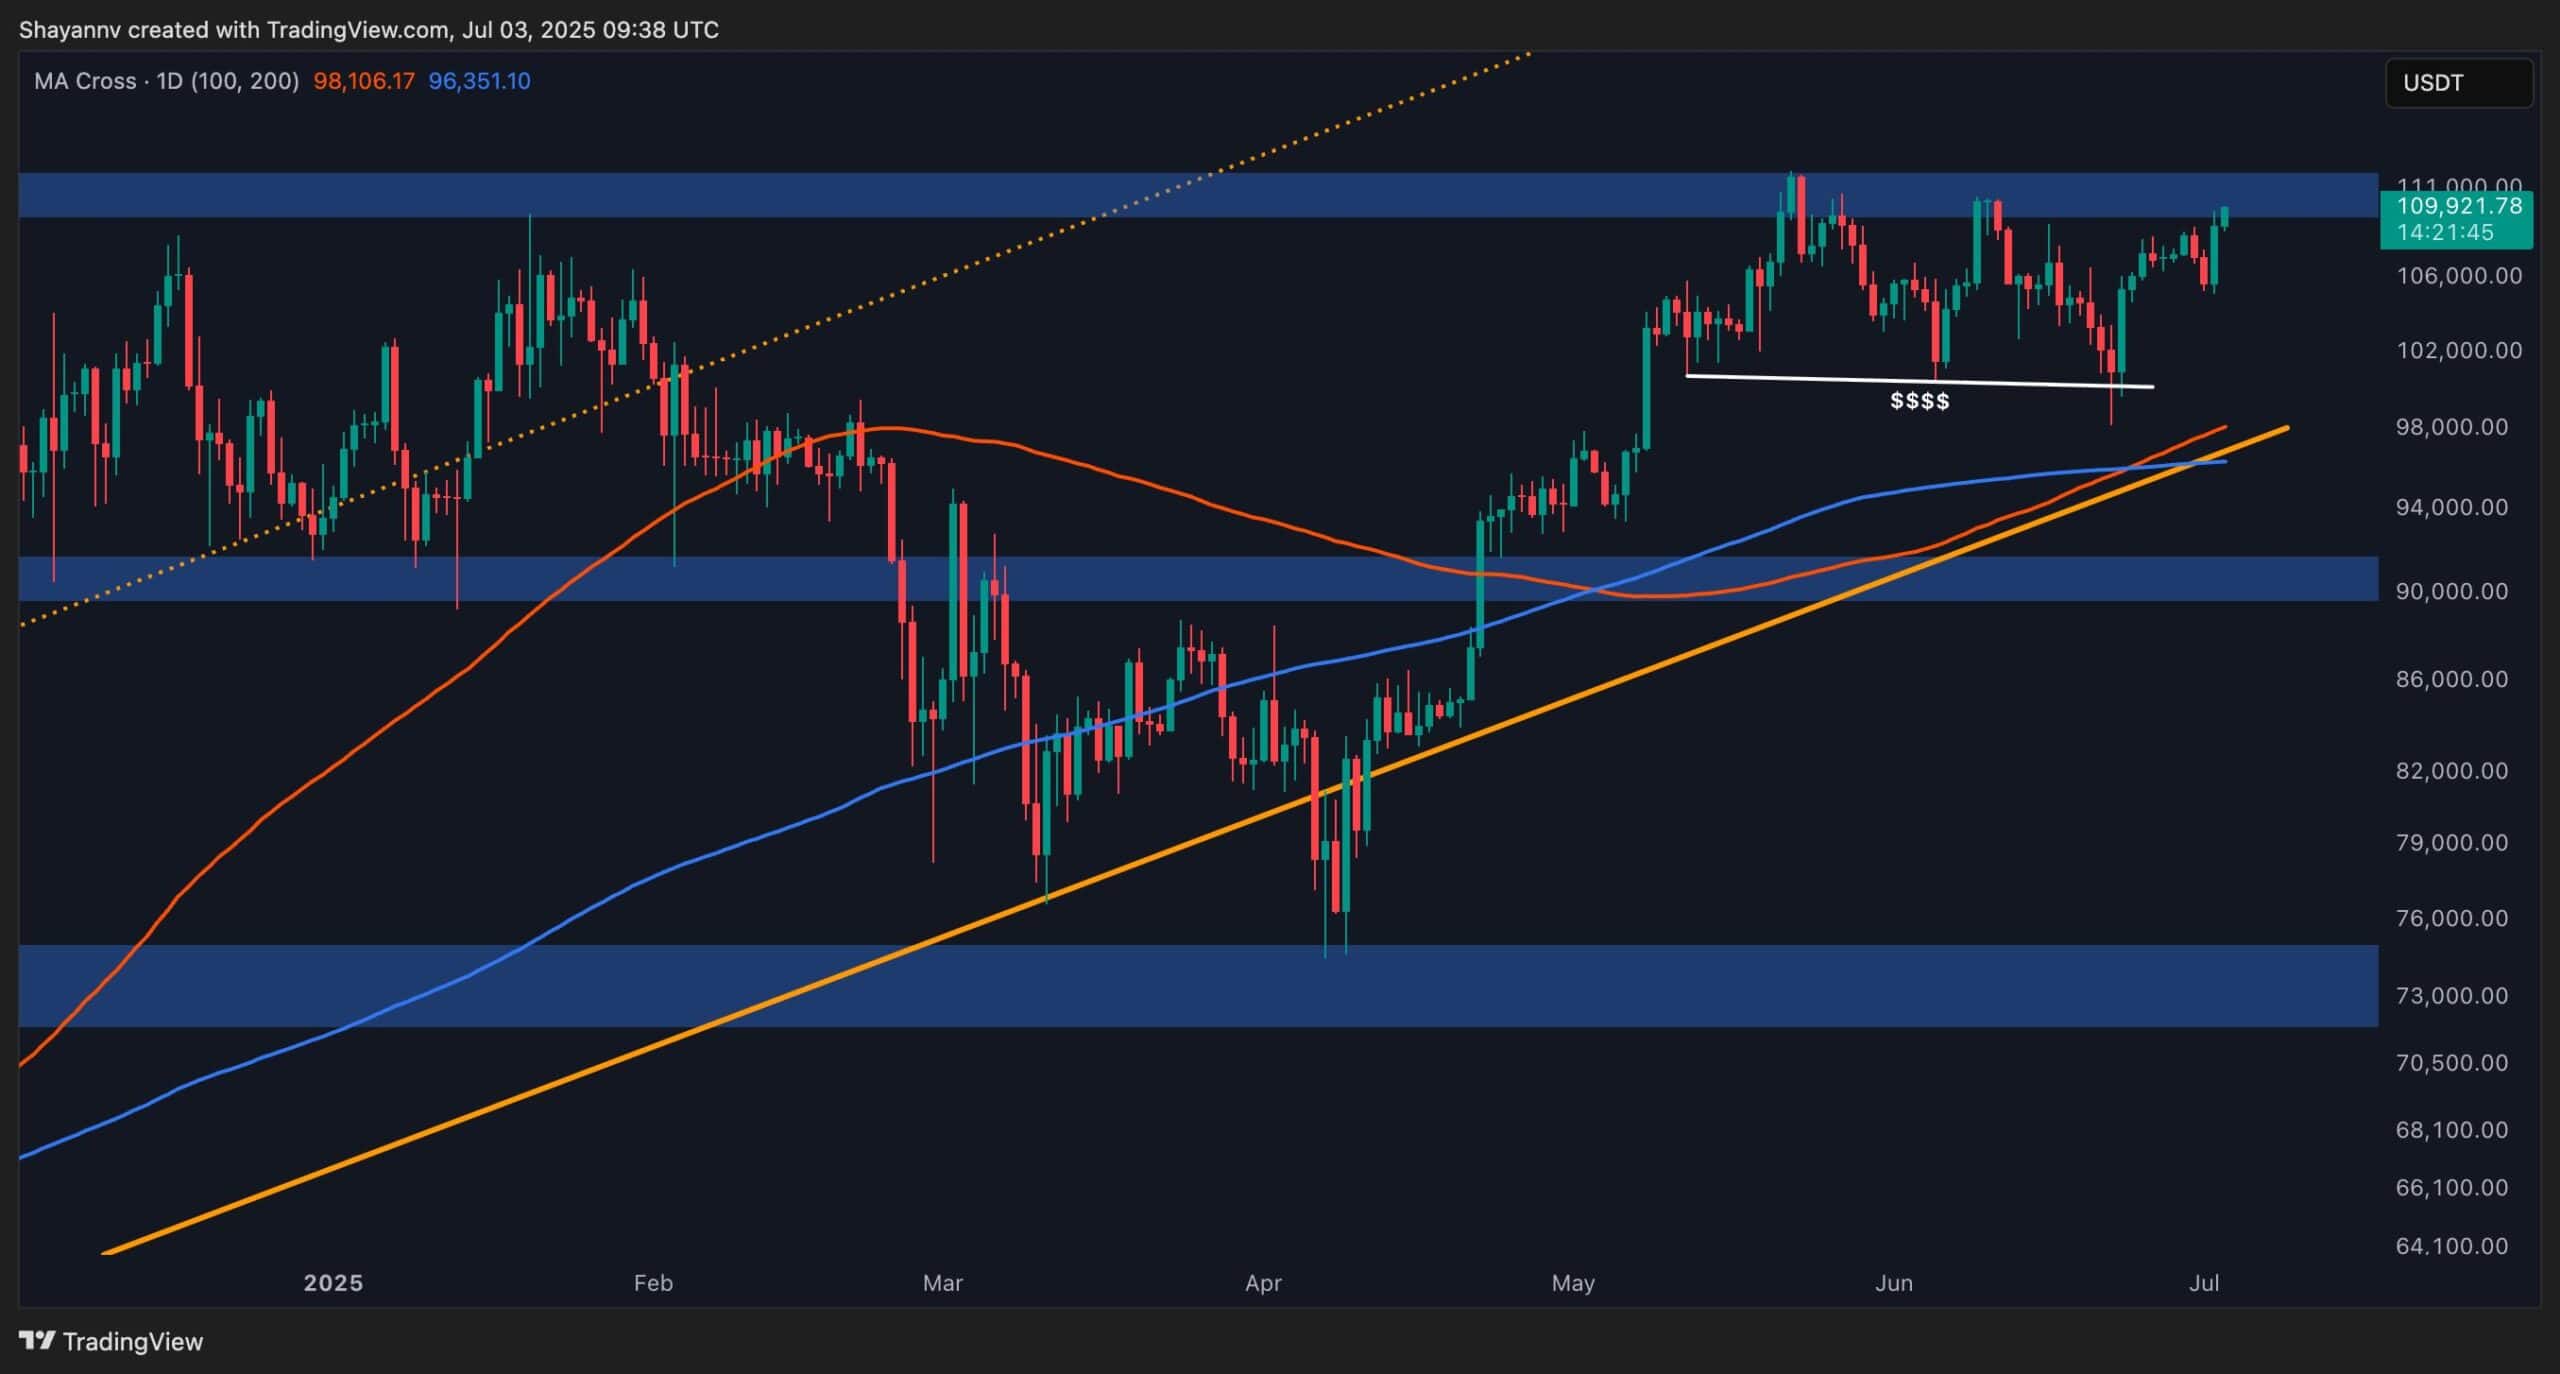
The Daily Chart
Following a healthy pullback to the $106K support level, BTC attracted notable demand, leading to a renewed rally back toward its all-time high at $111K. The ongoing price action reflects solid bullish momentum, likely stemming from sustained accumulation within the $100K–$111K consolidation range.
A key bullish signal has also emerged: the 100-day moving average has crossed above the 200-day moving average, forming a Golden Cross, historically associated with longer-term bullish trends. This reinforces the current upward trajectory and investor confidence.
However, BTC now faces a decisive test at the $111K ATH. A successful breakout above this psychological and technical barrier could ignite a fresh impulsive leg upward, with the $120K mark as the next major target.
The 4-Hour Chart
On the 4-hour timeframe, BTC initially faced rejection at the upper boundary of a descending wedge near $108K, triggering a brief dip to $106K. This move, however, was likely a liquidity sweep, a strategic pullback designed to trap retail sellers and enable smart money to accumulate long positions.
Following this, the BTC price broke above the wedge structure and completed a bullish retest, confirming the breakout. The cryptocurrency is now gaining momentum again, eyeing the $111K liquidity pool, where a cluster of stop orders likely resides.
This area is of high interest to large players seeking to trigger a buy-side liquidity cascade. If bulls can reclaim this level, a breakout is likely to follow, potentially propelling Bitcoin to new highs around $120K.

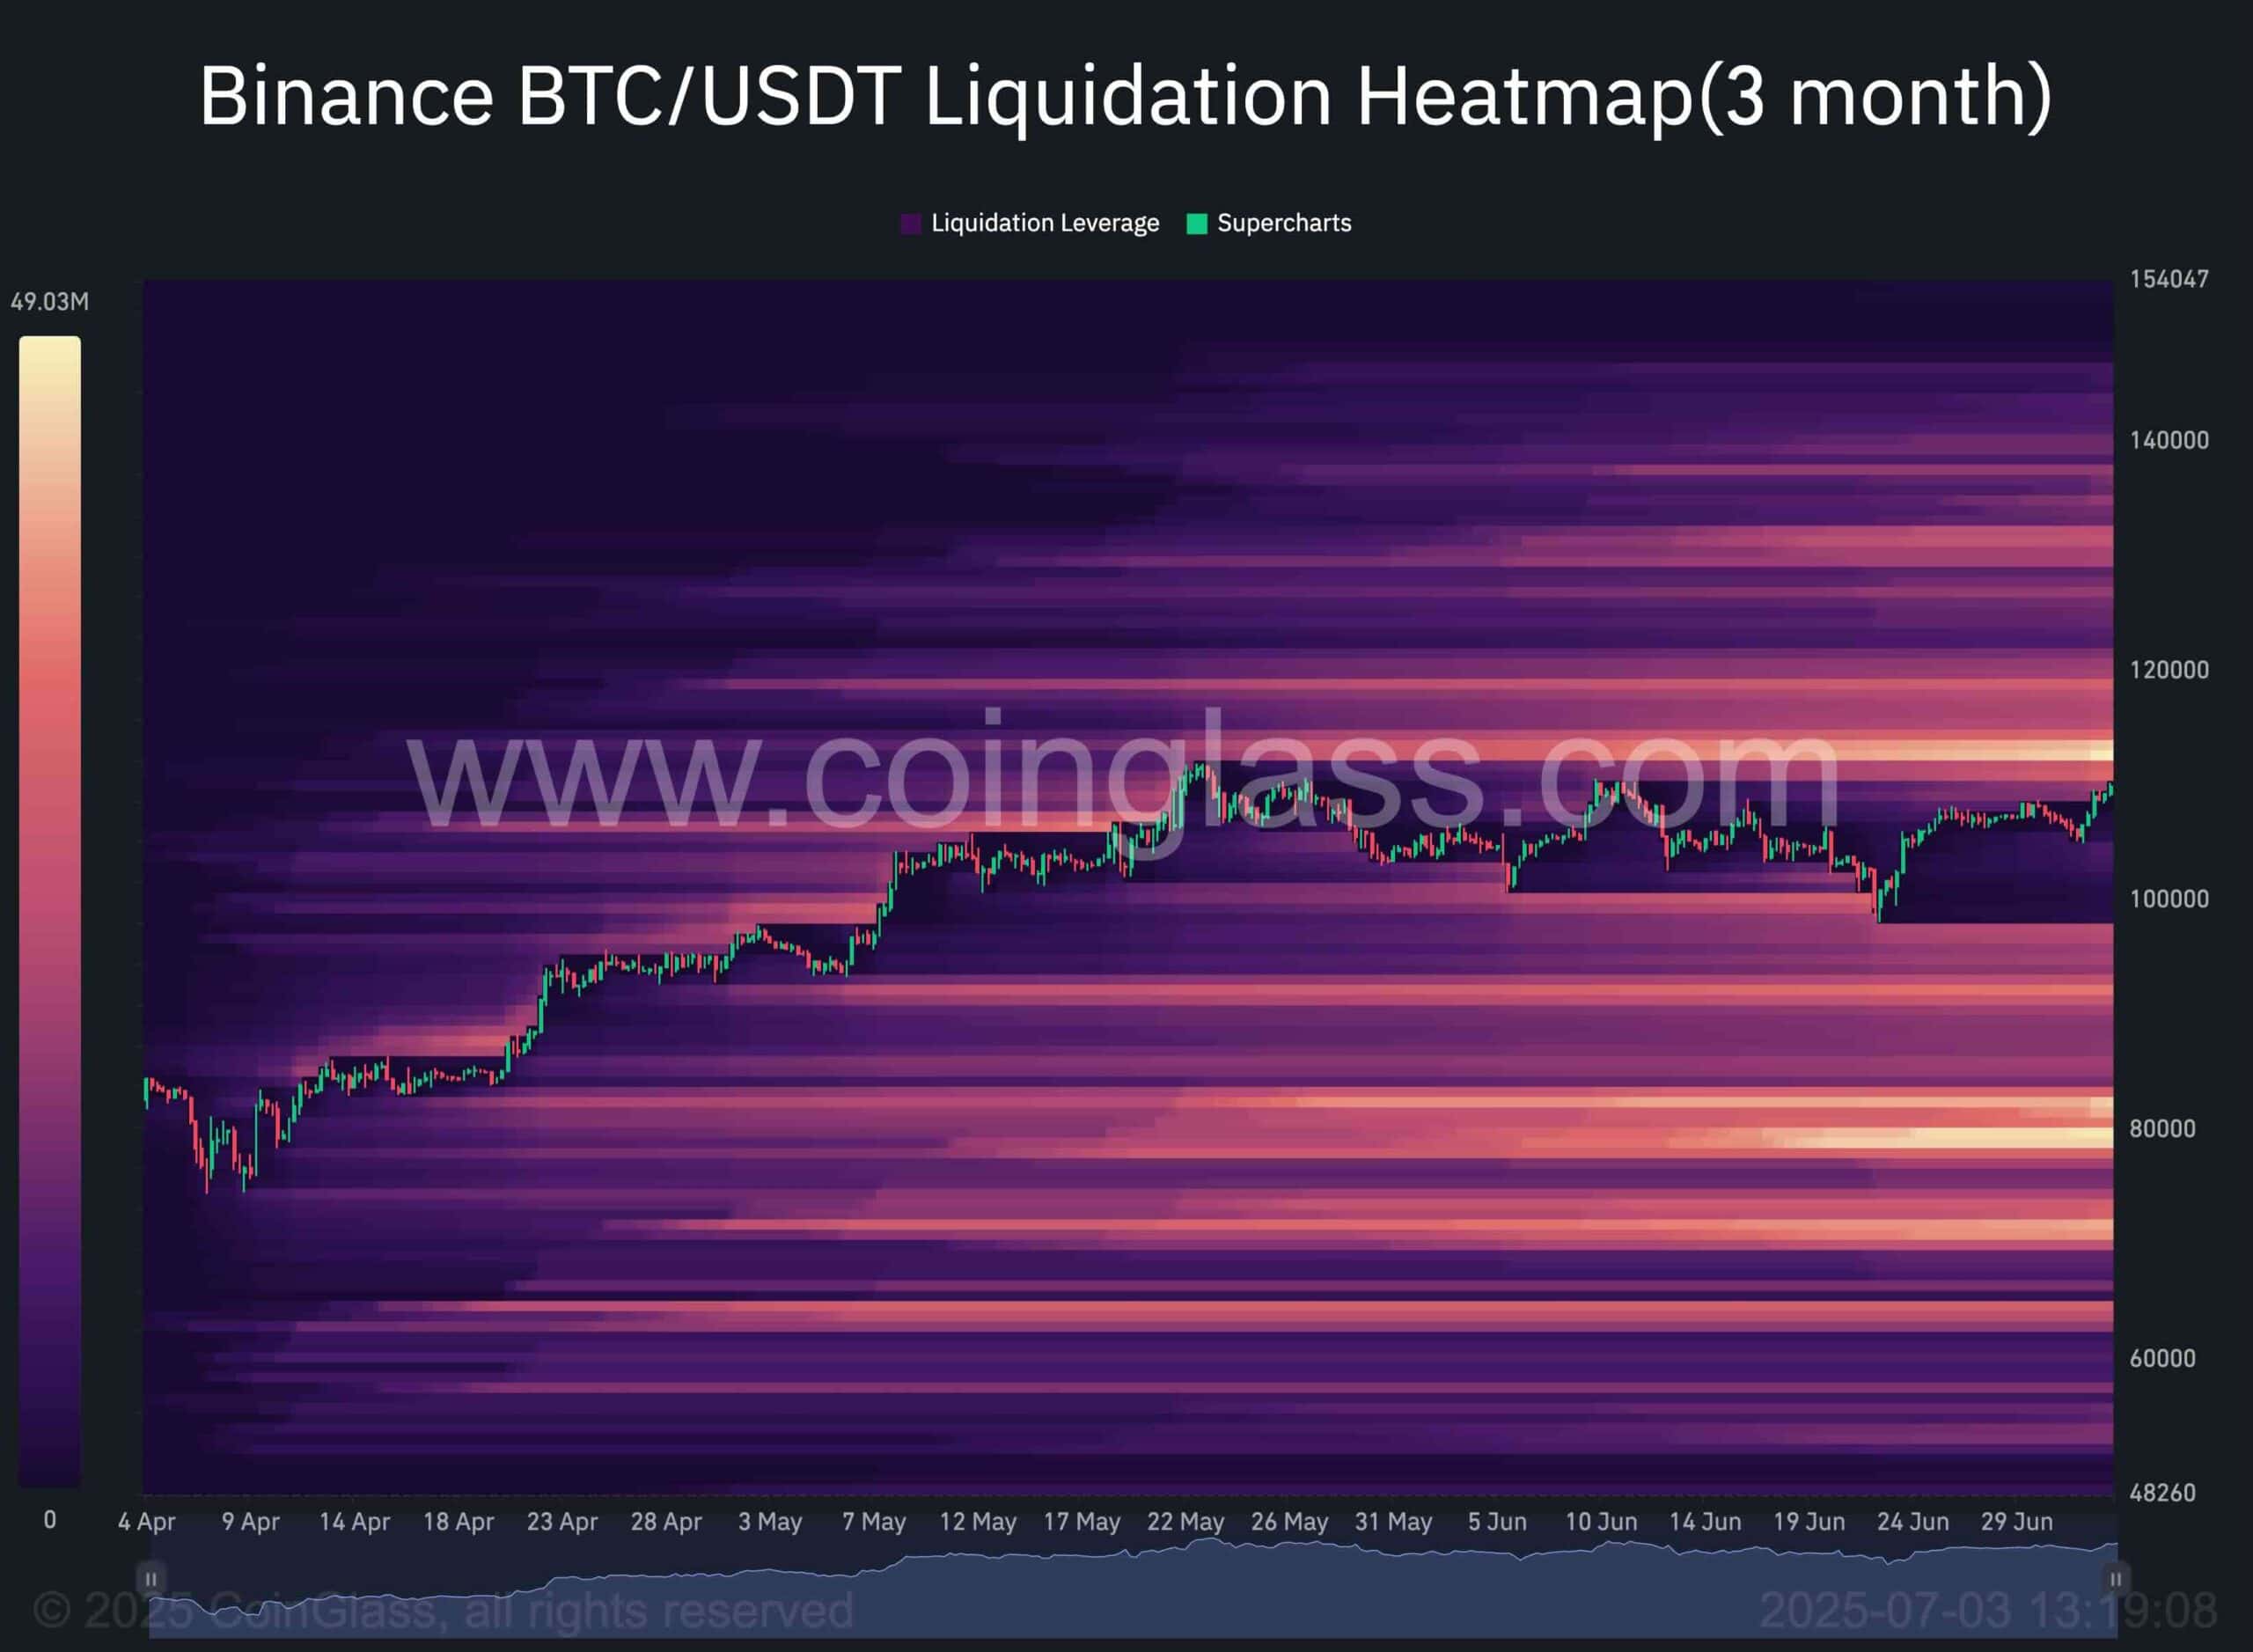
On-chain Analysis
By Shayan
This chart presents the Binance Liquidation Heatmap, which visualizes areas where significant liquidation events are likely to unfold. These zones often act as liquidity magnets, drawing price action toward them. Large market participants, commonly known as whales, strategically target these levels to enter or exit positions efficiently.
At present, a notable cluster of liquidation levels sits just above Bitcoin’s all-time high of $111K, suggesting a strong probability that the price may be drawn toward this region. If reached, this could spark a short-squeeze, amplifying upward momentum and potentially pushing BTC to new highs.
However, this liquidity cluster also reflects persistent selling pressure around current levels. Sellers remain active, keeping the $111K resistance firm. As such, this threshold stands as a critical decision point. A confirmed breakout above could initiate a powerful bullish continuation, while a failure to breach it may result in another rejection and possible retracement.