🚀 Bitcoin on the Brink: Will BTC Shatter Its ATH and Rocket to $120K?

Bitcoin teeters at the edge of history—again. The king of crypto coils like a spring, testing its all-time high with $120K in its crosshairs. Here's why traders are sweating their diamond hands.
The Setup: BTC's price action mirrors past breakout patterns—consolidation tightens, volatility compresses. Textbook pre-pump behavior.
The Catalyst: Spot ETF inflows hit $1B daily this week. Wall Street's latecomers FOMO-buying while OG whales smirk behind anonymous wallets.
The Math: Clear the ATH at $73K, and Fibonacci extensions point to $120K. Simple as your broker's explanation for why your altcoin portfolio bleeds out.
Market makers love these psychological levels—liquidity pools cluster around round numbers like bankers at a cocaine buffet. Whether this rally holds depends on who breaks first: paper-handed retail or overleveraged shorts.
One truth remains: Bitcoin doesn't care about your TA, your feelings, or the SEC's next desperate lawsuit. The network keeps hashing. Tick tock, next block.
Bitcoin Price Analysis: Technicals
By Shayan
The Daily Chart
BTC continues to face challenges in surpassing the key $111K resistance level, its current all-time high, after several weeks of consolidation. Despite multiple attempts, intensified selling pressure and profit-taking at this level have repeatedly halted bullish momentum, resulting in sideways price action.
Recently, the cryptocurrency dipped below the $100K support zone, triggering a liquidity sweep and collecting the fuel for a potential new leg up.
However, the subsequent rebound has stalled around the $107K mark, signaling weakening bullish strength. If demand returns and buying pressure increases, a breakout above the $111K ATH could materialize. Otherwise, another rejection is likely, pushing the price back toward the critical $100K support in the coming sessions.

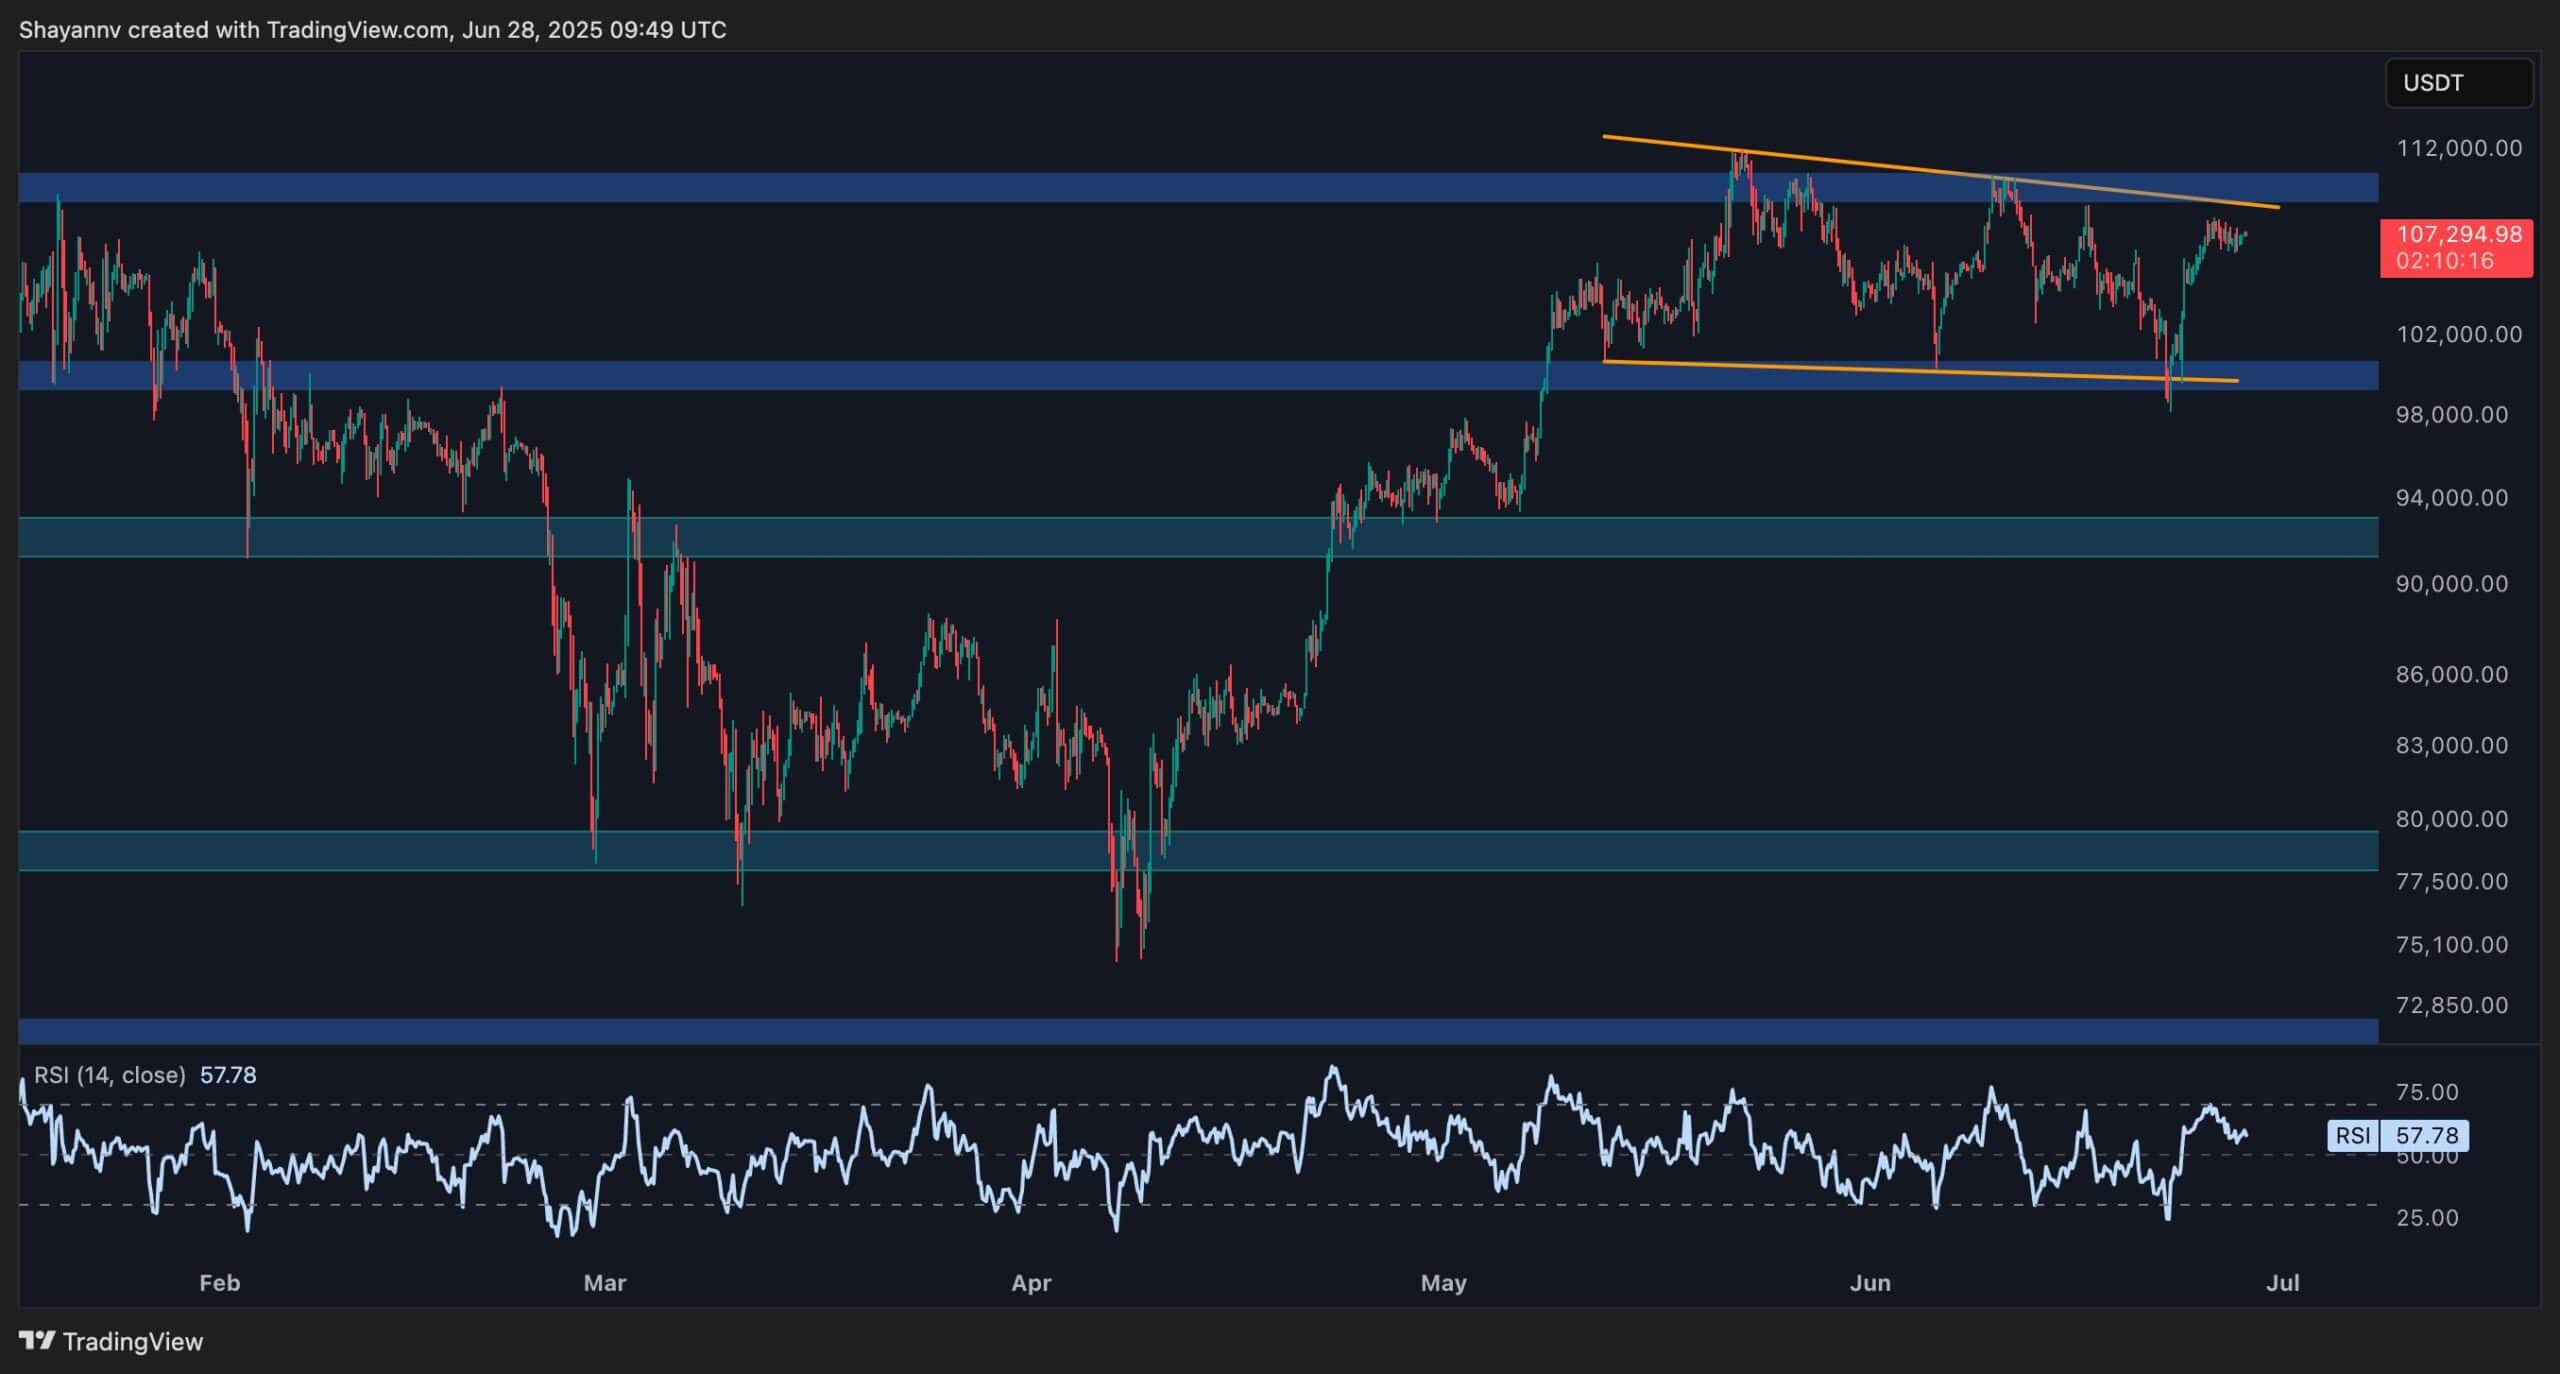
The 4-Hour Chart
On the lower timeframe, Bitcoin has been forming a bullish flag just below its all-time high, a pattern typically signaling continuation of the existing uptrend.
Following a liquidity grab beneath the lower boundary of the flag near $100K, bitcoin rallied toward the upper boundary at $107K. Despite this upward move, the price has entered a low-volatility phase, indicating a loss of momentum as it approaches resistance.
Should a breakout occur early next week, a new all-time high is likely. Conversely, failure to hold above the current level could trigger another drop, sending the price back toward the lower end of the flag. Until then, price action remains confined, with both bulls and bears waiting for confirmation of the next directional move.
Bitcoin On-chain Analysis
By Shayan
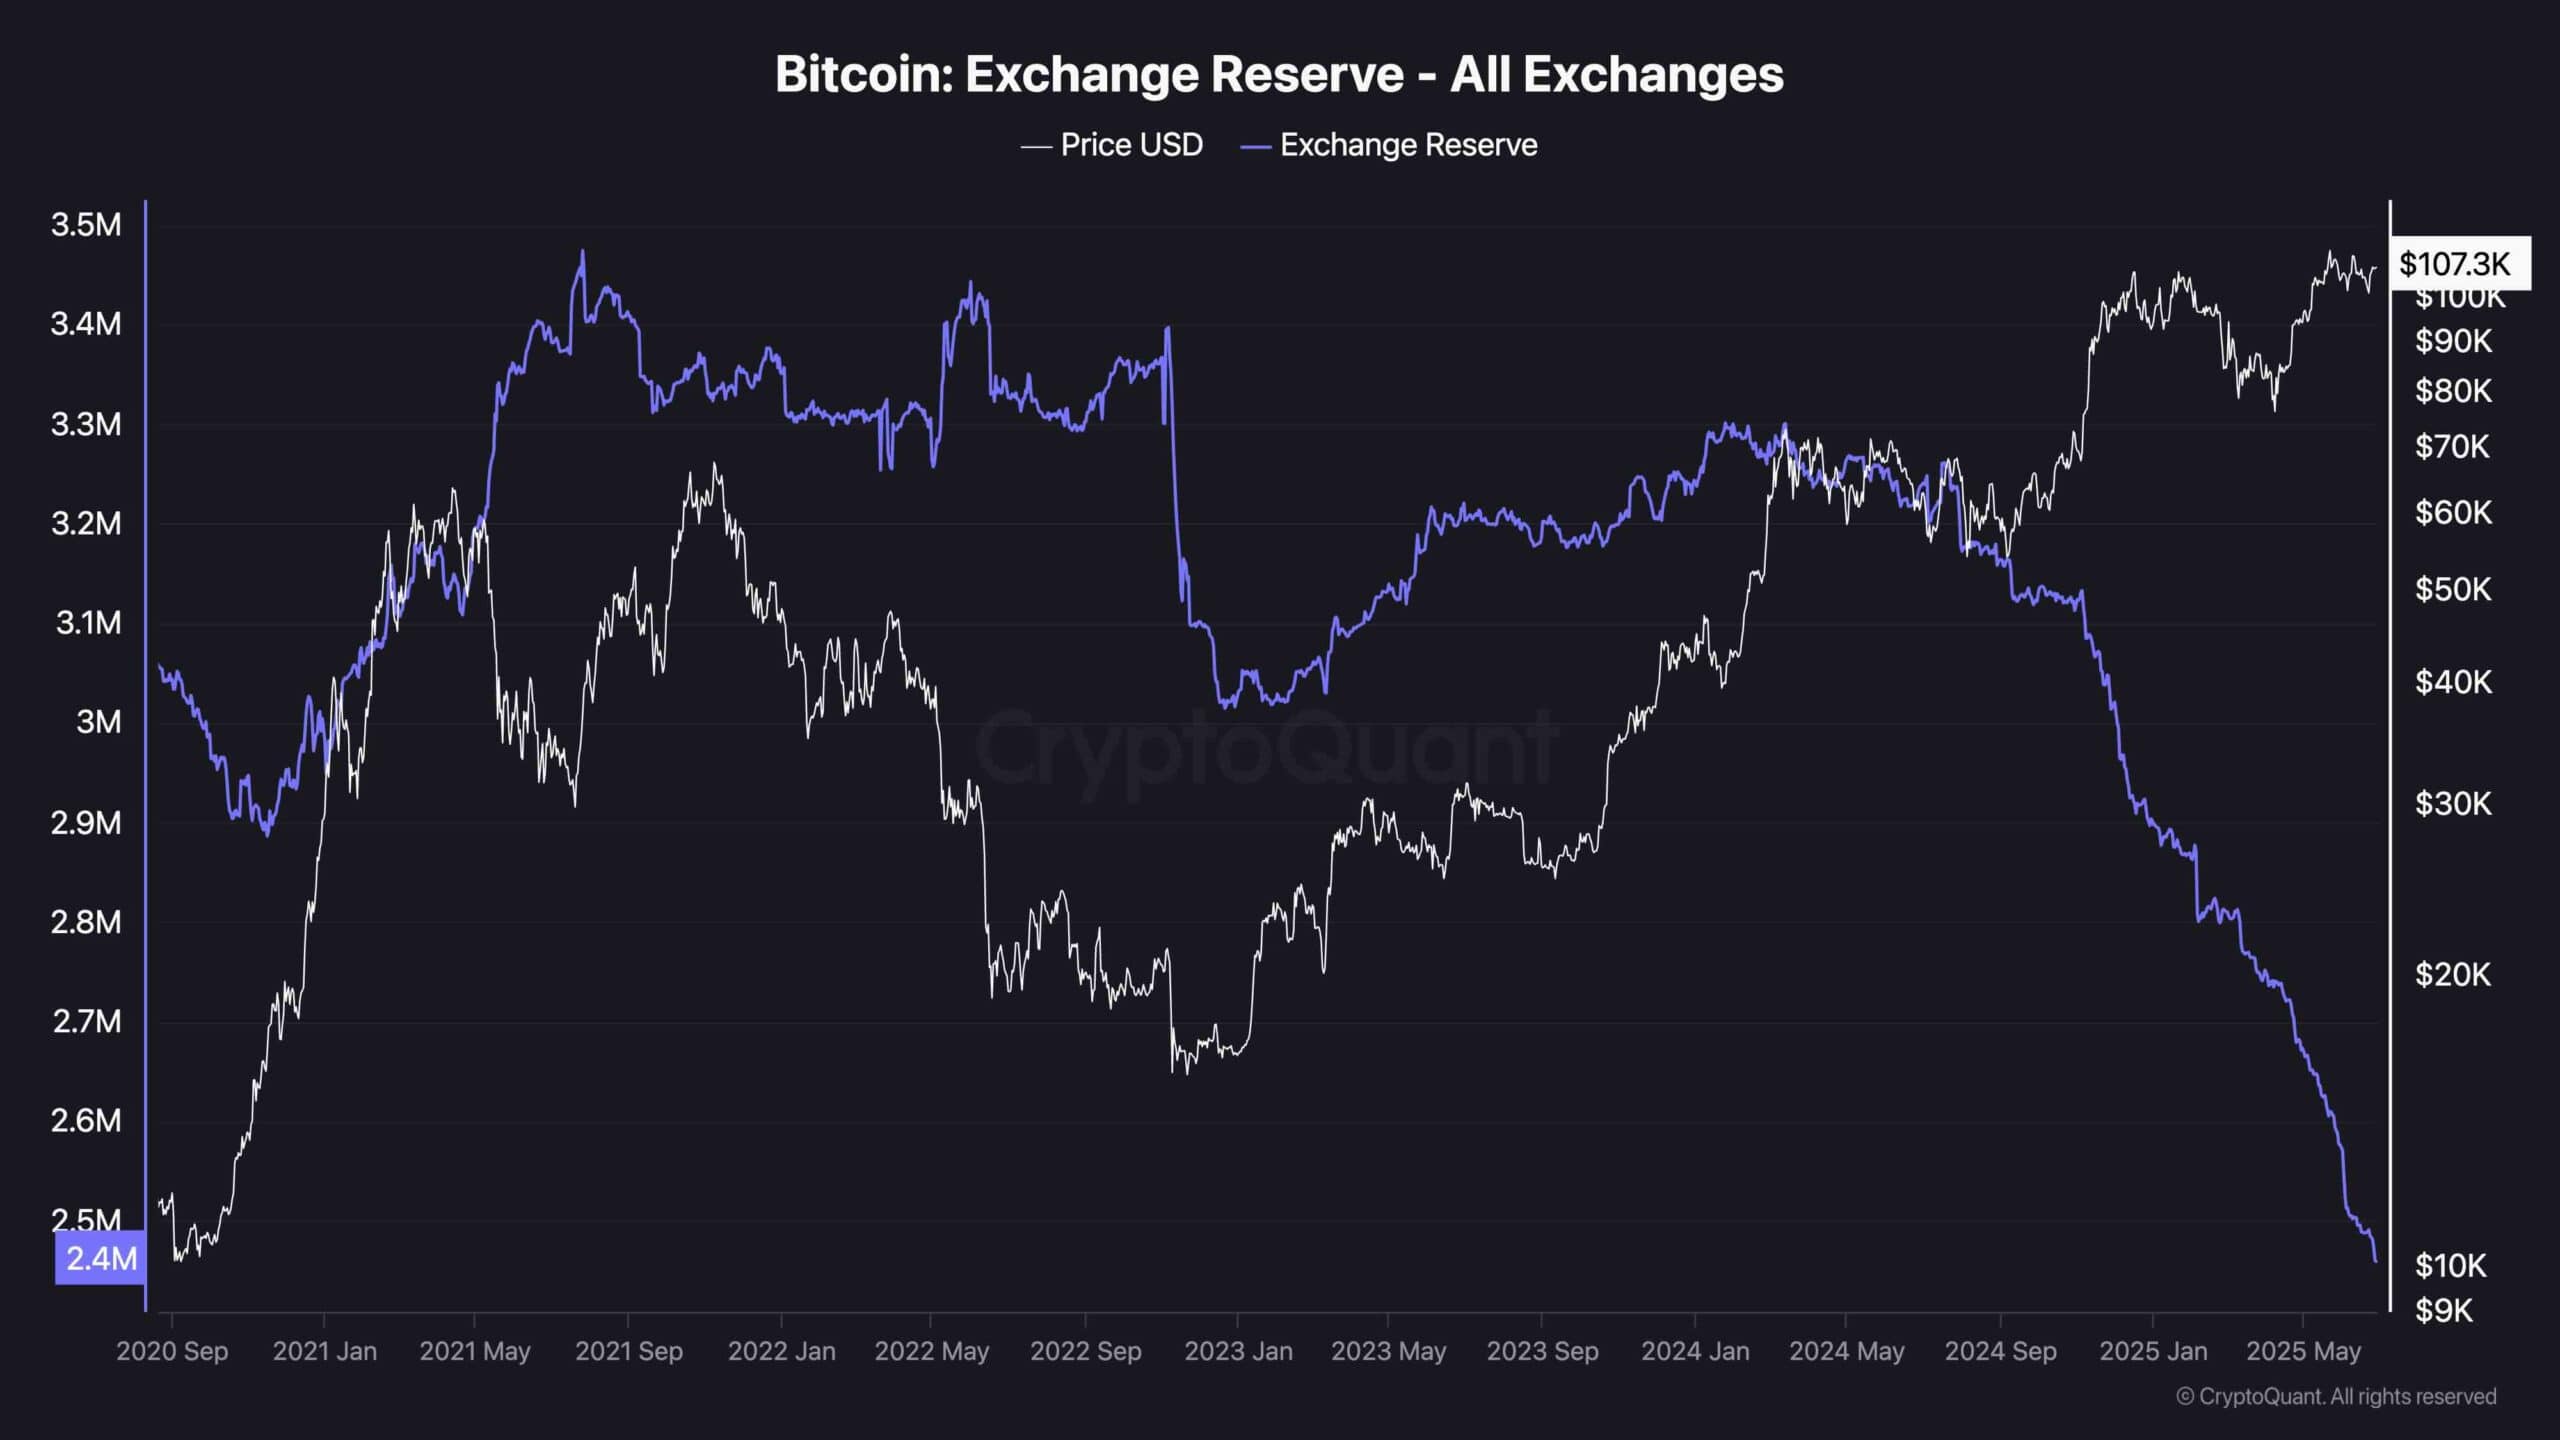
On-chain data from CryptoQuant reveals a sharp decline in Bitcoin reserves held on centralized exchanges, now at their lowest levels in several years.
This ongoing outflow underscores a growing preference for self-custody and accumulation among investors, a pattern typically associated with reduced sell-side pressure and a long-term bullish outlook. A lower supply of readily available BTC on exchanges often sets the stage for potential supply-side shocks during periods of renewed demand.
That said, while dwindling reserves are historically correlated with major bull runs, they should not be viewed as immediate catalysts for short-term price rallies.
Market conditions and liquidity dynamics still play a vital role, and without a corresponding uptick in demand, price corrections remain a possibility. In summary, the exchange reserve trend highlights strong foundational support for Bitcoin, but near-term price action may still be subject to broader macro or technical headwinds.