XRP at a Crossroads: Ripple’s Make-or-Break Moment Arrives

Ripple's XRP is teetering on the edge of a major price decision—will it soar or stumble?
The sixth-largest cryptocurrency by market cap has been consolidating near a critical technical level, with traders watching for the next big move. No fancy indicators needed here—it's pure supply vs. demand psychology playing out on the charts.
Bull Case: Breaking through this resistance could trigger a 30% rally as sidelined capital floods in. The SEC lawsuit resolution remains the elephant in the room, but institutional adoption continues creeping upward.
Bear Case: Failure to hold support risks a 20% plunge to retest 2024 lows. Trading volume tells the real story—recent spikes suggest either accumulation or distribution, and we'll know which soon enough.
Meanwhile, traditional finance giants still can't decide if crypto is 'rat poison' or their next revenue stream—but they'll happily charge you 2% management fees either way.
Technical Analysis
By ShayanMarkets
The USDT Pair
On the daily chart, XRP/USDT remains compressed within a long-term descending channel pattern, bounded by a descending trendline from the yearly highs and a horizontal support NEAR $1.95, with tons of sell-side liquidity resting under it.
The pair is currently trading around $2.15, just under both the 100 and 200 moving averages. The RSI is also hovering near 44, indicating the lack of momentum and confirming the range-bound behavior. The asset is currently coiling just above the highlighted liquidity level, suggesting that if sellers manage to breach $1.95, the next logical demand zone lies around $1.6.
Meanwhile, upside resistance remains at the upper bound of the channel near $2.60, which has rejected multiple attempts in recent weeks. A clean break and daily close above that trendline WOULD potentially confirm a bullish rally, with the target being around $3. Until then, this is still a neutral structure favoring range traders rather than trend-followers.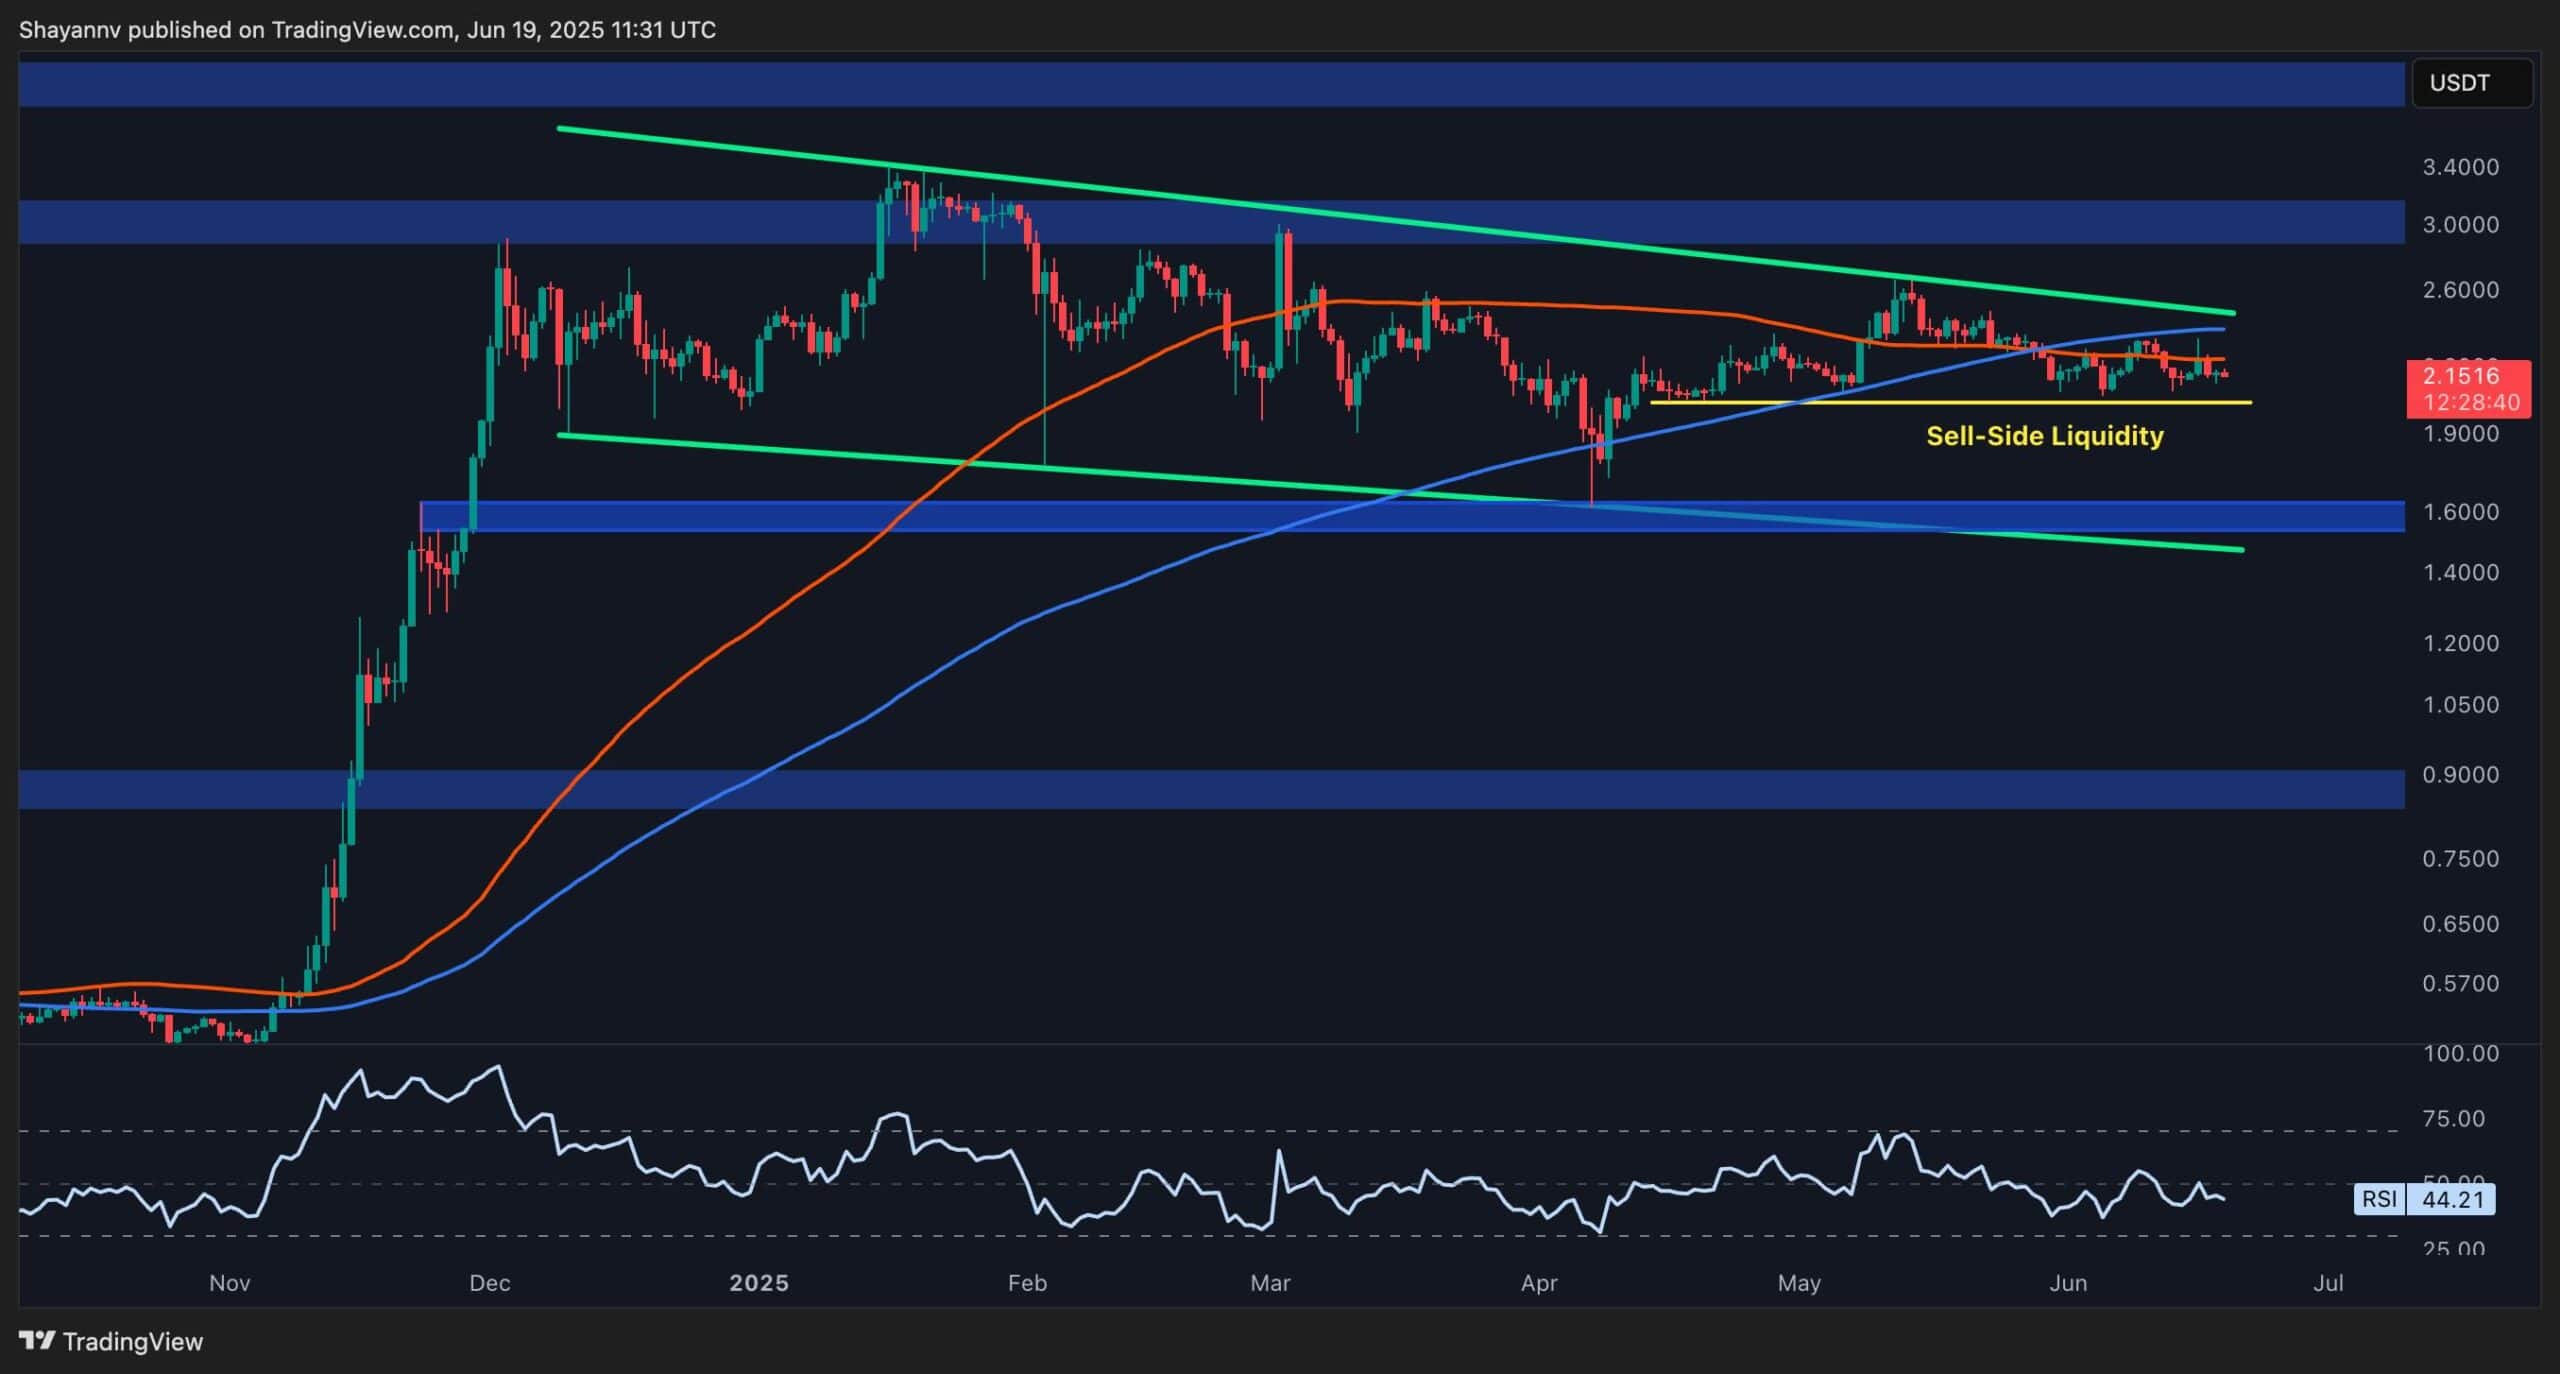
The BTC Pair
Against Bitcoin, XRP has shown persistent weakness since March, consistently printing lower highs and lower lows. The chart highlights a large descending wedge formation, with price now moving toward the lower boundary of the pattern. Both the 100 and 200 moving averages are angled downward after a bearish crossover, and the RSI is still depressed near 42, reflecting ongoing relative underperformance.
That said, the pair is approaching the imbalance zone (FVG) left from the explosive rally in late 2024. This pocket, located just below 1900 SAT, could act as a magnet for price while also offering potential for a relief bounce. If the buyers step in, the first challenge lies near the higher trendline of the wedge around 2200 SAT, which coincides with a horizontal resistance level.
A decisive MOVE above that level could shift short-term momentum, but unless that happens, the pair remains locked in a clear bearish structure.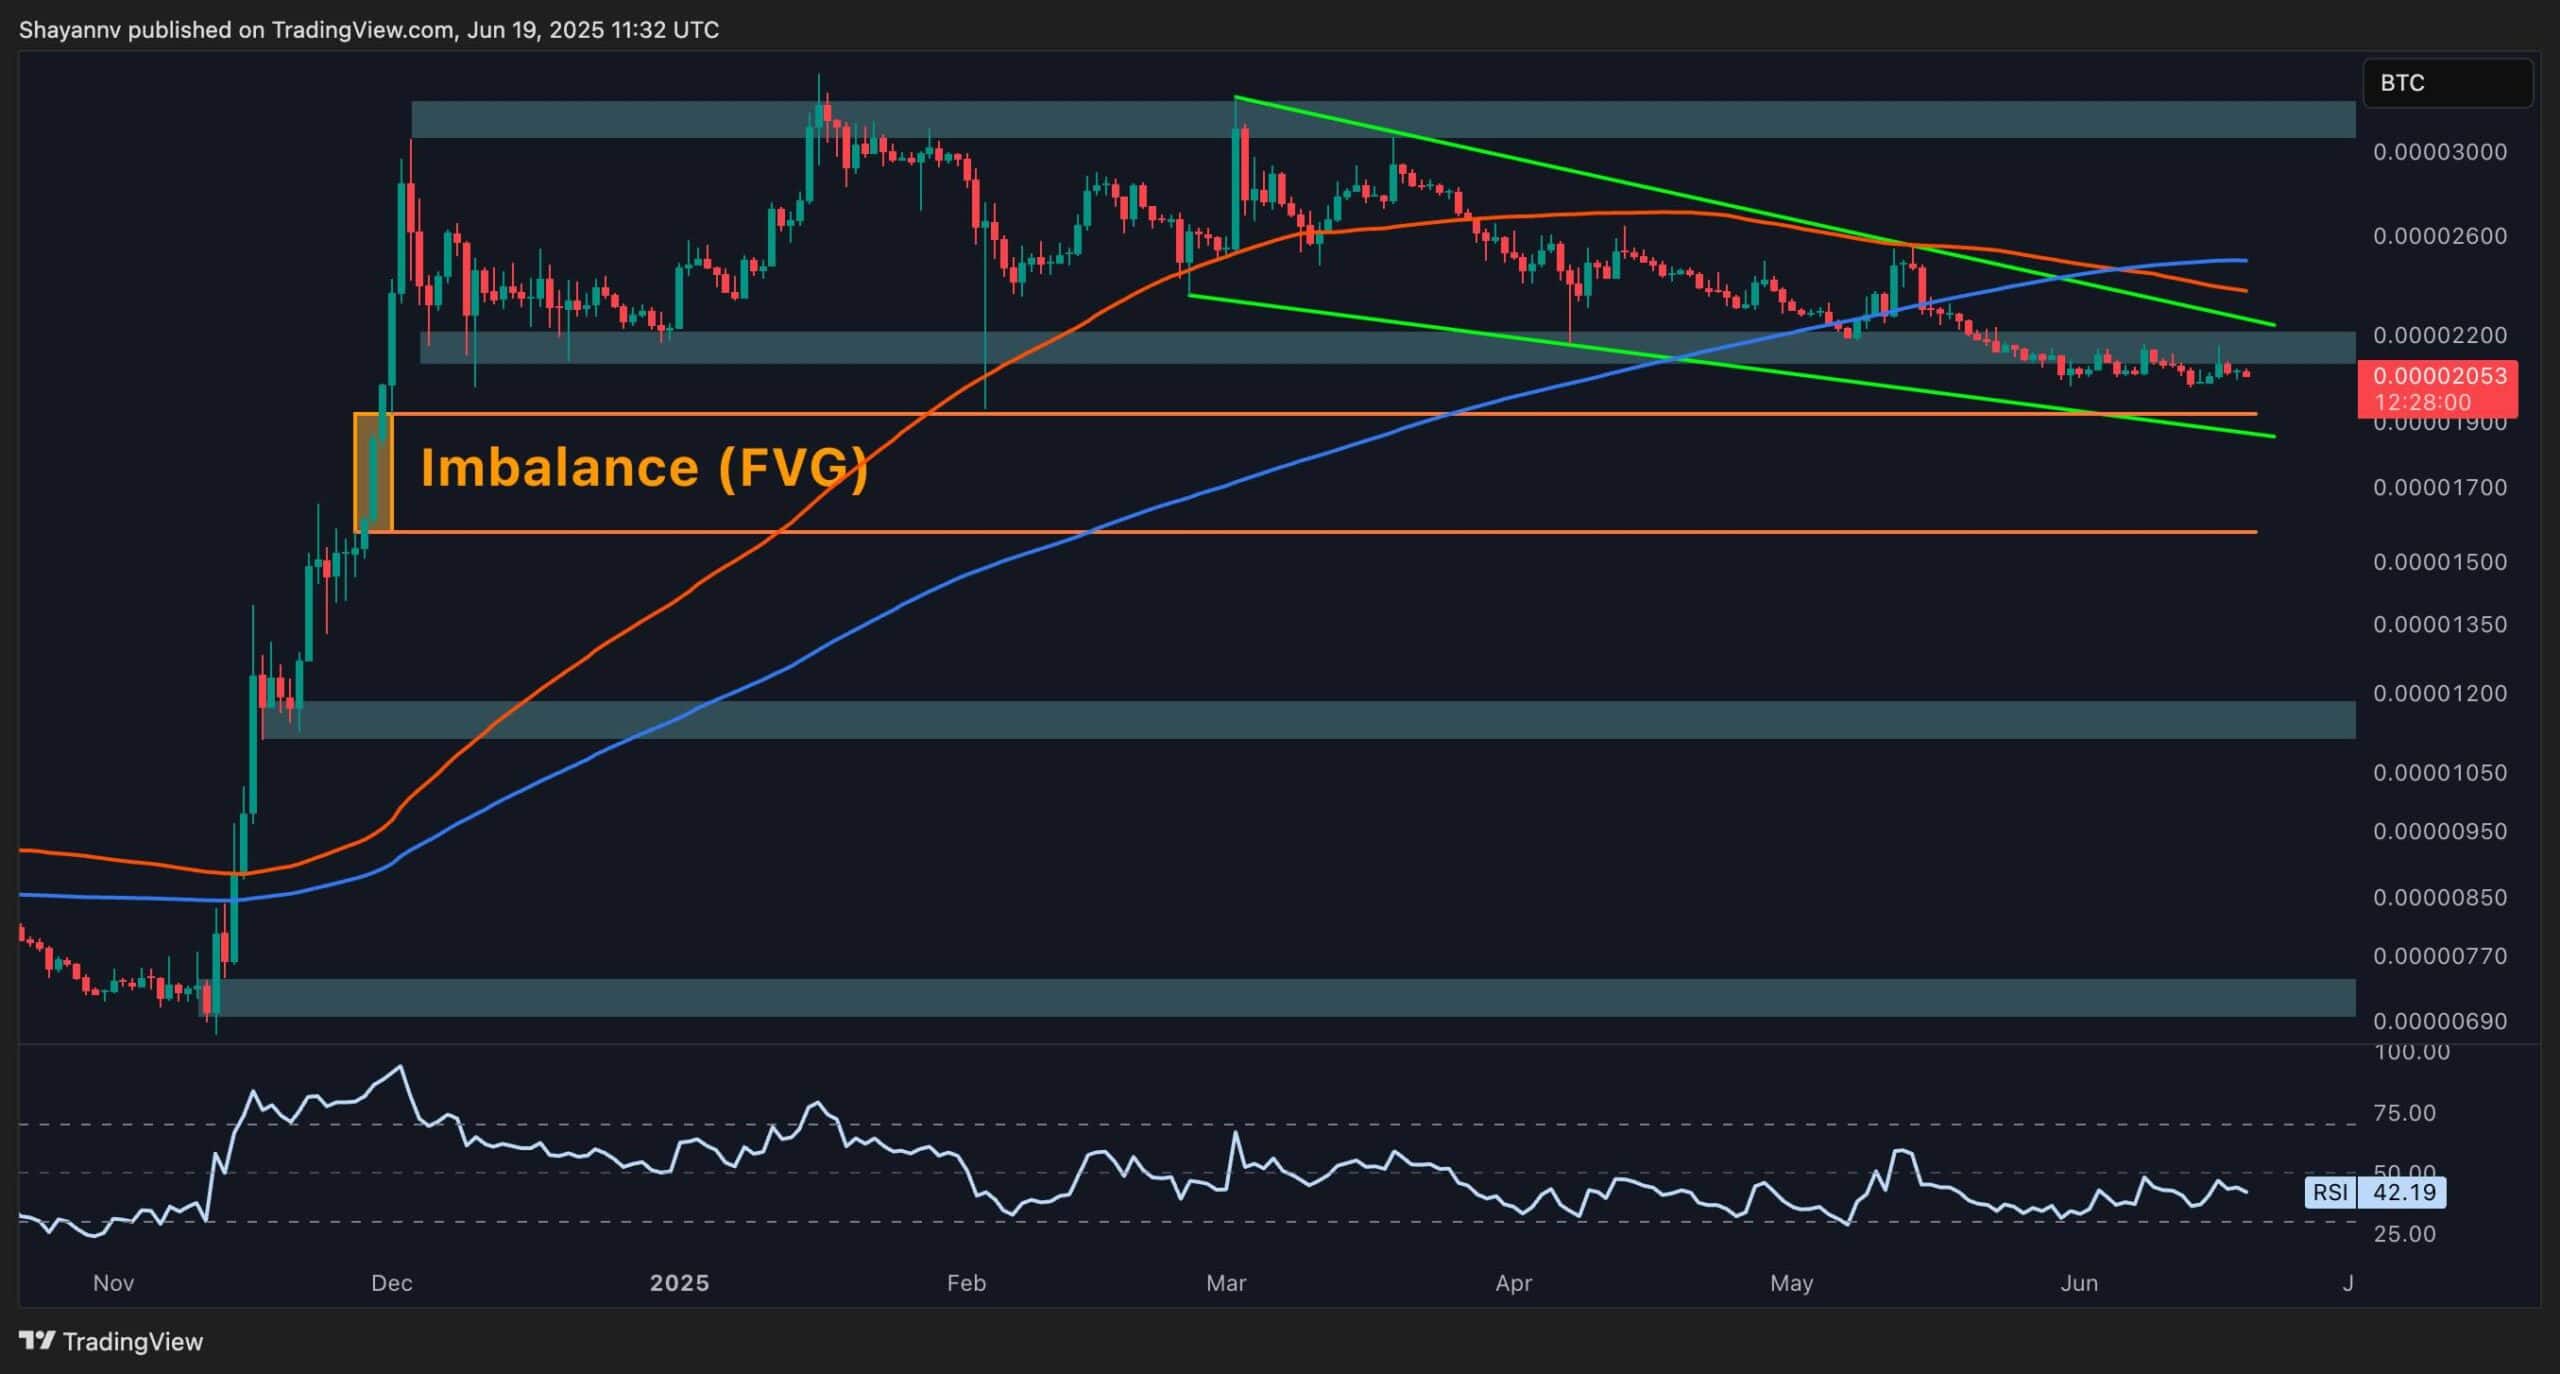

Log in to Reply
Log in to comment your thoughtsComments
Related Articles
|Square
Get the BTCC app to start your crypto journey
Get started today Scan to join our 100M+ users