Bitcoin at a Crossroads: Final Dip Before Shattering All-Time Highs in 2025?

Bitcoin''s price action has traders on edge—is this the last bargain before the rocket fuel kicks in?
Market whispers suggest BTC''s current pullback might be the final pitstop before a historic breakout. With institutional FOMO brewing and retail investors lurking, the stage is set for a potential moonshot.
Technical indicators flash bullish: • RSI cooling off from overbought territory • Key support levels holding strong • Whale accumulation patterns mirroring previous ATH runs
Meanwhile, Wall Street''s ''experts'' still can''t decide if crypto is a scam or the future—classic hedge fund indecision while the train leaves the station.
One thing''s certain: when Bitcoin starts moving, it doesn''t wait for permission slips from traditional finance. Buckle up.
Technical Analysis
By ShayanMarkets
The Daily Chart
BTC encountered slight rejection at the key $111K resistance region, signaling profit-taking by market participants at this critical level. However, the price has now entered a daily Fair Value Gap (FVG) between $106K and $108K, an area typically associated with strong demand and buying interest. This zone may provide the necessary support to halt the current corrective phase and trigger a bullish reversal.
If Bitcoin manages to hold above this FVG, the price could soon resume its upward momentum, potentially initiating a fresh impulsive rally toward the $111K all-time high. However, a breakdown below the $106K-$108K FVG would increase the likelihood of a deeper correction, with the $100K level emerging as the next major support.
Broadly speaking, BTC remains range-bound between the $100K support and the $111K resistance. While a breakout from either boundary could lead to a significant directional move, current market structure suggests a higher probability of an eventual bullish move, possibly setting a new all-time high in the coming months.
The 4-Hour Chart
On the 4-hour timeframe, bitcoin faced rejection from a critical order block near the $110K level, reflecting renewed selling pressure. This rejection has initiated a short-term bearish retracement, pushing the price toward a key support zone.
This zone includes a 4-hour order block between $106K and $105K, which coincides with a potential retest of a previously broken bullish flag pattern. A successful pullback to this region WOULD validate the earlier breakout and set the stage for a renewed bullish surge. This move could mark the beginning of another upward impulse toward uncharted territory above $111K.
Nonetheless, the price action around this support zone is critical. If Bitcoin fails to hold this level and breaks below the order block, the bullish scenario will be invalidated in the short term, increasing the risk of a correction down to the $100K support level.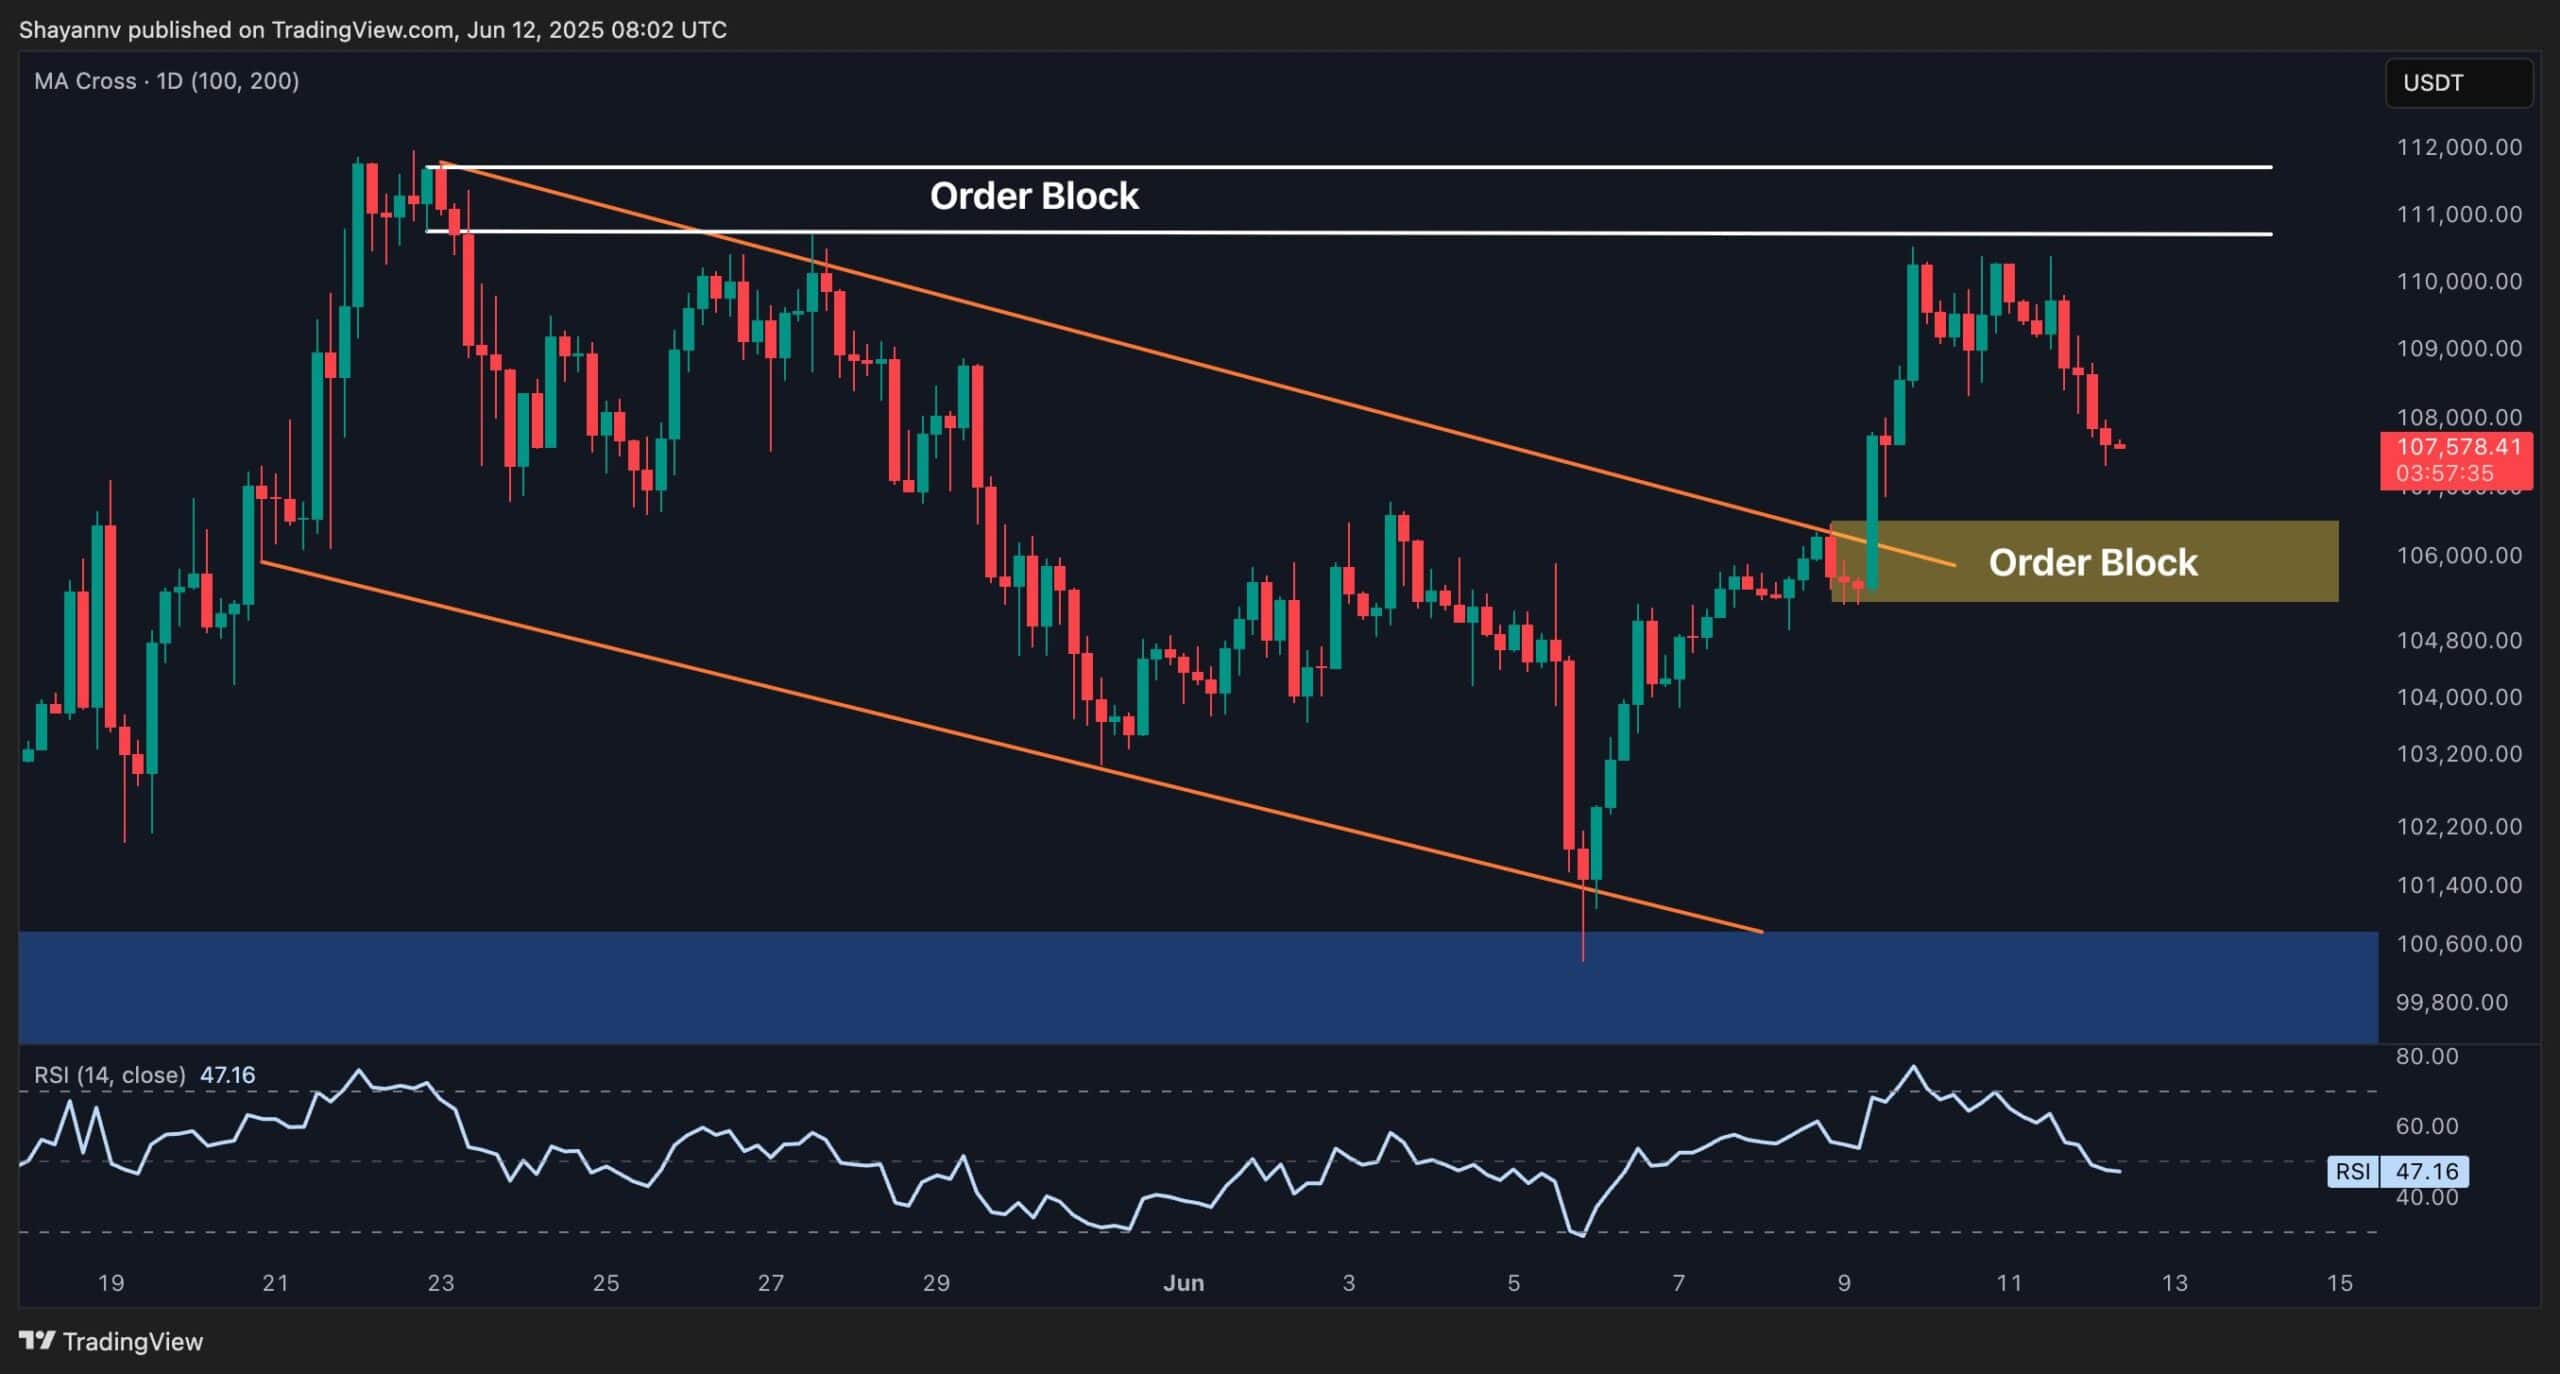
On-chain Analysis
By ShayanMarkets
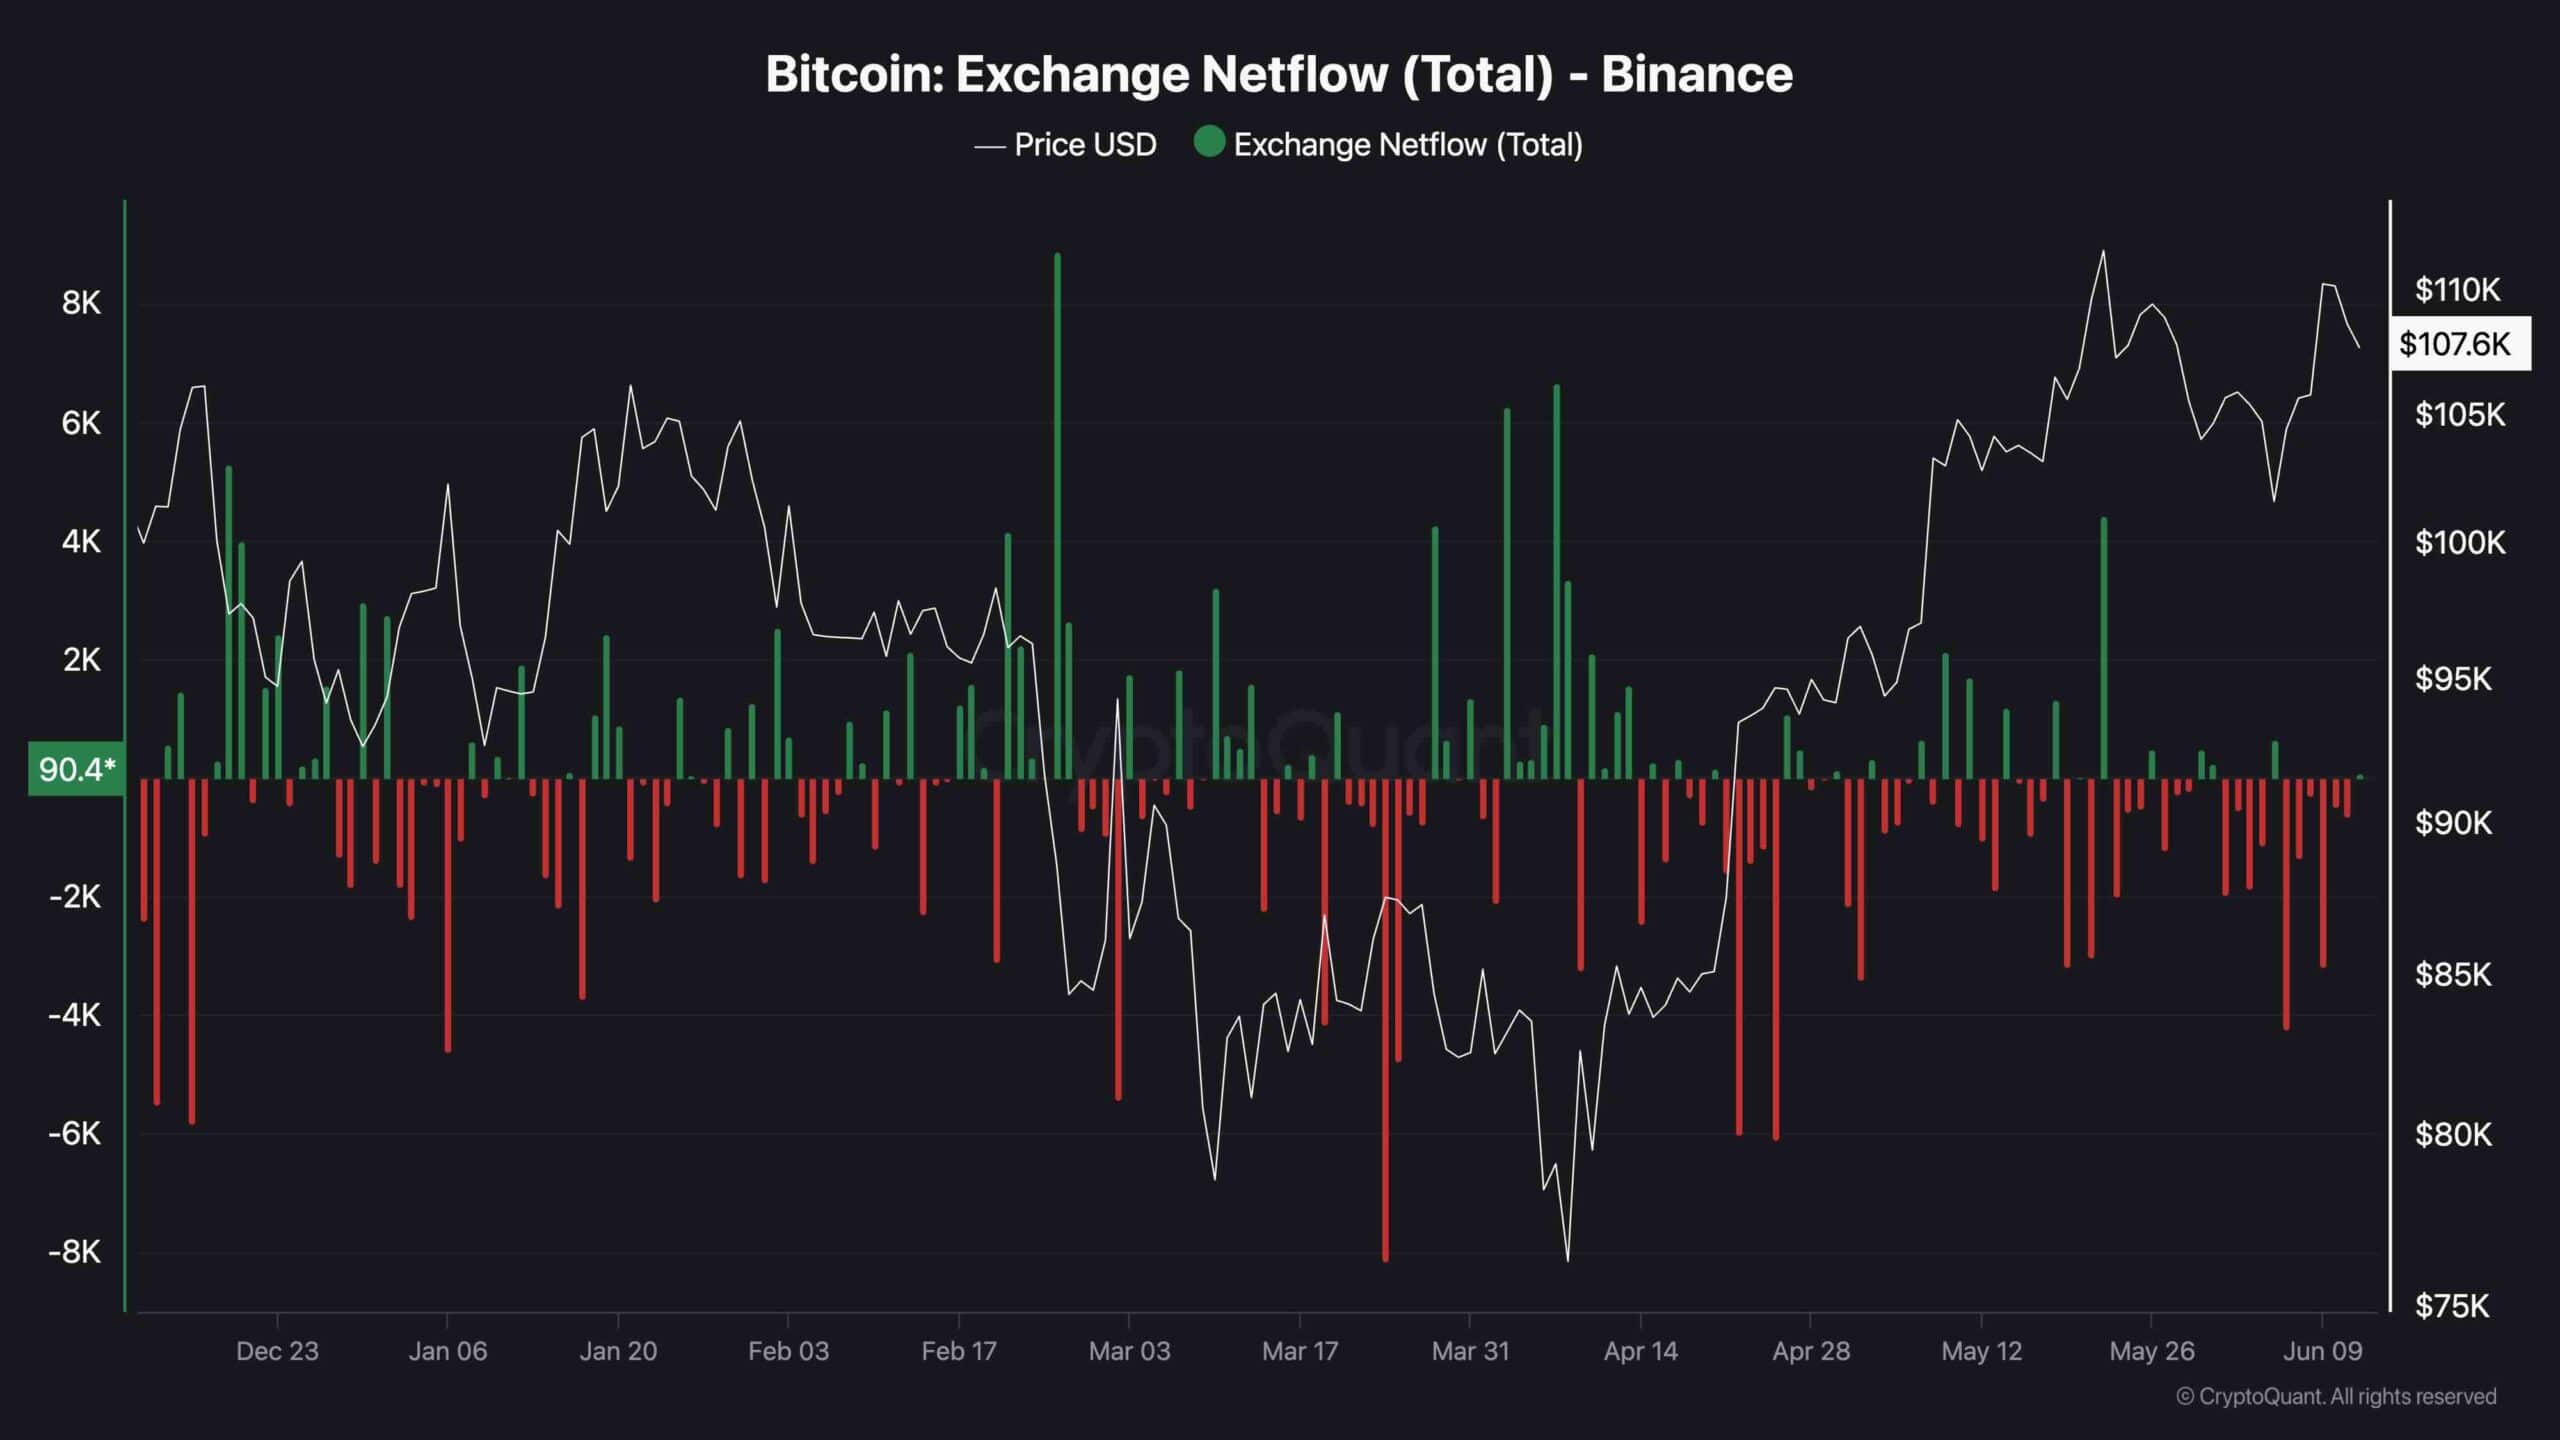
Recent on-chain activity indicates a strengthening case for Bitcoin’s continued uptrend, with key metrics showing reduced exchange supply and growing confidence from long-term investors.
Data from Binance, the world’s largest crypto exchange, reveals a notable trend: since June 6th, over 7,000 BTC have been steadily withdrawn from the platform. This consistent outflow, illustrated by a series of negative netflow days, suggests that investors are increasingly opting to move their holdings into cold storage rather than keeping them on exchanges for immediate trading.
Such behavior typically signals a shift toward long-term holding and reduces the volume of Bitcoin readily available for sale, easing sell-side pressure on the market.
This development coincides with increased accumulation from long-term holders. Together, the combination of significant BTC outflows from Binance and aggressive long-term accumulation paints a bullish picture. With fewer coins available for trading, reduced selling pressure, and signs of renewed investor confidence, the broader on-chain and technical landscape indicates a favorable setup for Bitcoin’s continued upward movement.