Ethereum’s $3K Showdown: Will the Bulls Break Through or Get Trampled?

ETH’s price teeters at the psychological $3,000 barrier—again. Traders hold their breath as liquidity pools tighten and derivatives heat up.
Key levels to watch: A clean break above $3,050 could trigger algorithmic buying sprees, while rejection here might send ETH back to test $2,800 support. Meme coin degens aren’t helping—half the gas fees this week funded cartoon animal tokens.
Institutional flows tell a different story: BlackRock’s ETH ETF holdings now equal 3% of circulating supply. Meanwhile, crypto VC firms quietly rotate out of ’web3 infrastructure’ plays and into—surprise—more ETH.
Closing thought: If ETH can’t punch through now with spot ETF tailwinds, Wall Street might just reclassify it as ’fixed income’ and call it a day.
Technical Analysis
By ShayanMarkets
The Daily Chart
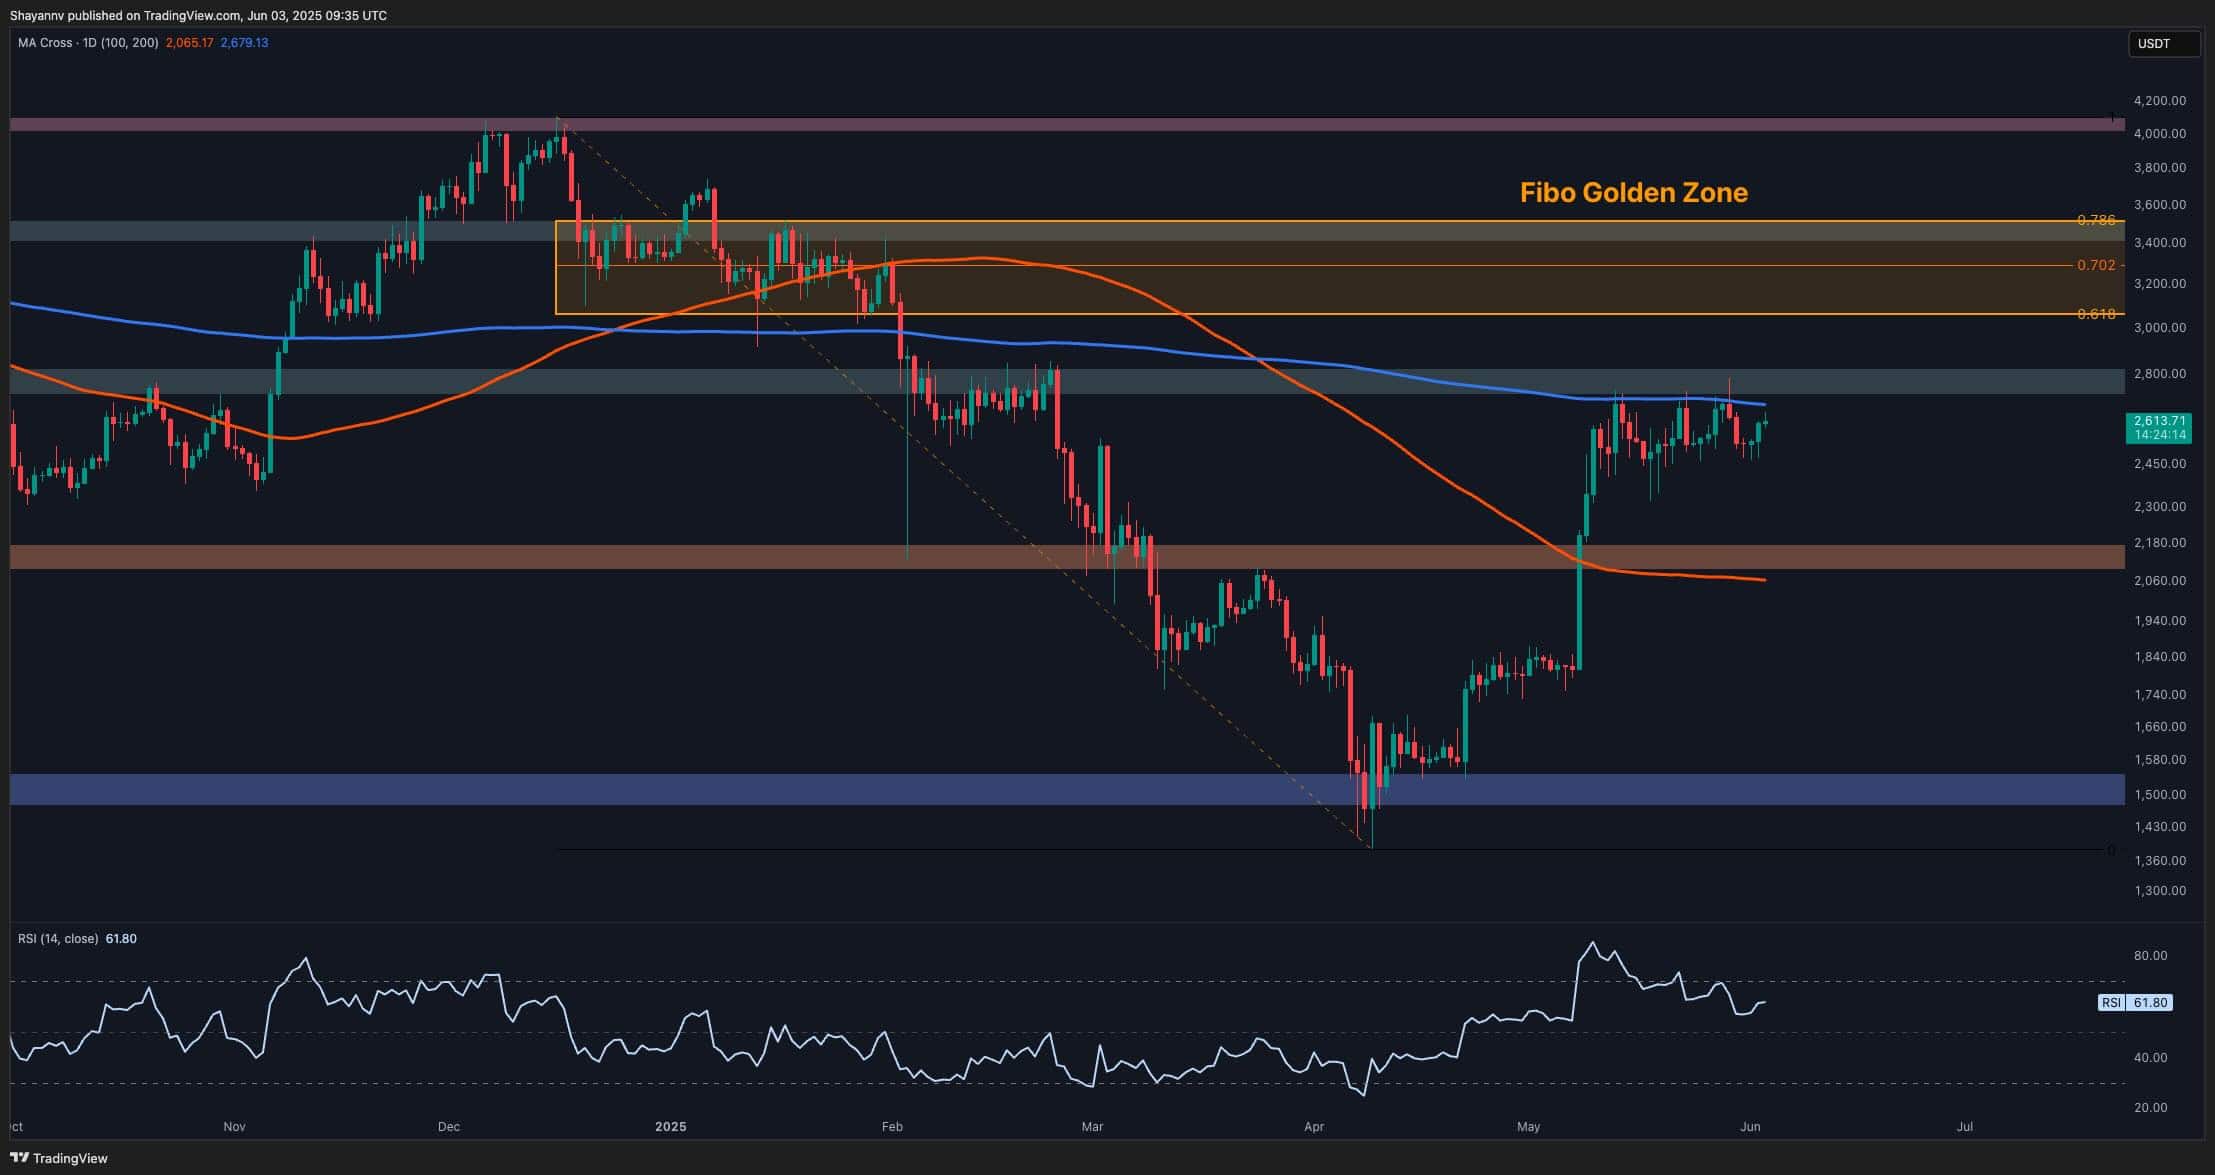
On the daily chart, ETH remains capped below the $2,800 resistance zone, which aligns with the 200-day moving average. Despite repeated attempts, price has failed to break and hold above this area, forming a potential local top. The RSI is also hovering near 62, showing a loss of bullish momentum compared to earlier in the rally, and potentially a bearish divergence.
The current market structure resembles an ascending channel or potential distribution range. A clean break above $2,850 could open the way toward the $3,000–$3,200 region, which aligns with the Fibonacci golden zone, while a breakdown below $2,400 may shift momentum back in favor of sellers and target $2,100.
The 4-Hour Chart
On the 4-hour chart, the price action is forming an ascending channel, often a bearish signal, especially near key resistance. The market recently bounced from the lower boundary near $2,500, retesting mid-range liquidity. However, upward follow-through has been weak. Moreover, the RSI is trending sideways just above 50, suggesting indecision.
This consolidation comes after a clear imbalance (FVG) from the May breakout, which has yet to be revisited. If the asset breaks down from this channel, a sweep of that fair value gap area around the $2,200 mark becomes likely. On the other hand, a push above the recent highs with volume could invalidate the bearish pattern and trigger continuation.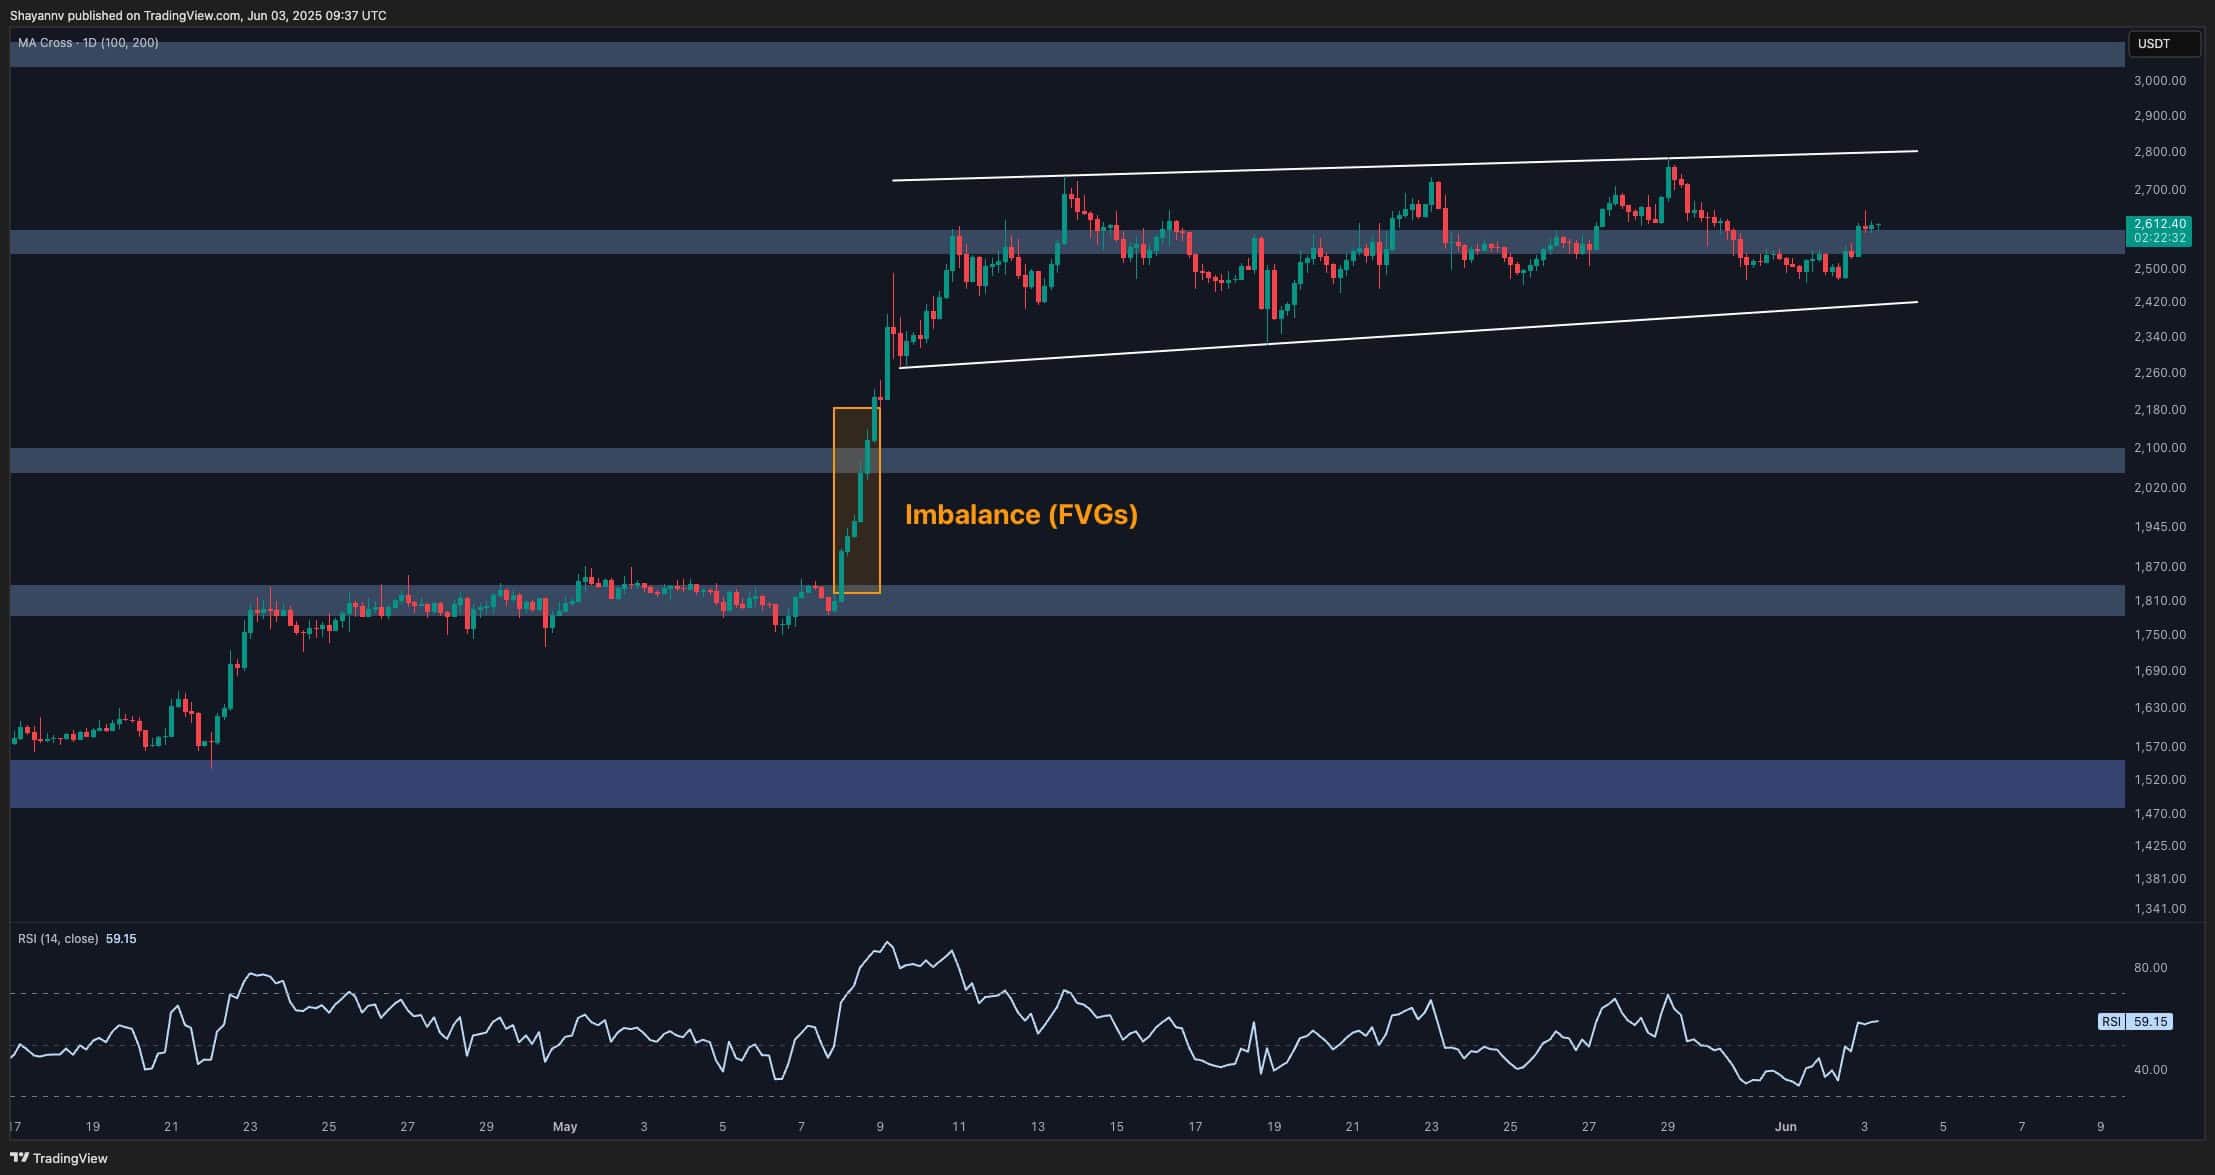
Sentiment Analysis
Ethereum’s open interest is flashing a warning sign. While the price has remained relatively flat and range-bound over the past week, open interest has continued to rise aggressively, now surpassing previous highs when ETH was trading above $3,000.
This divergence indicates growing leverage and speculation at lower price levels, without the confirmation of a strong price rally. Historically, such imbalances between open interest and price tend to lead to sharp volatility, either via a short squeeze or a long liquidation cascade. The market is coiled, and this crowded positioning could act as fuel for a large MOVE once a direction is chosen.
