Bitcoin Stumbles: Is This the Start of a Painful Downtrend?

BTC’s latest rejection sparks fears of a drawn-out bear phase—just as Wall Street ’experts’ finish their morning coffee.
Key signals flashing red
The king of crypto faces its toughest test since the last cycle, with technicals suggesting more pain ahead. No fancy jargon—just a clean breakdown of what matters.
Market psychology shifts
Traders are eyeing those key support levels like hawks. Break below? Brace for impact. Hold? Another shot at glory. Either way, the casino stays open 24/7.
Remember: Corrections burn weak hands, but they’re the gasoline for the next rally. Unless you’re leveraged 100x—then you’re just fuel.
Technical Analysis
By ShayanMarkets
The Daily Chart
BTC experienced a notable rejection from the $111K supply zone after capturing the buy-side liquidity above the January-February highs. This MOVE triggered an immediate drop and initiated a correction, with current price action showing signs of potential continuation lower.
The daily RSI has also cooled off and is now hovering around the neutral 50 zone, indicating a pause in momentum. The 100 and 200-day moving averages remain bullishly aligned below price (located in the $90K-$95K range), and there is a visible fair value gap (FVG) between $101K and $98K, which may act as a magnet for price in the short term, but can also act as a demand zone to push the asset higher after penetration.
Yet, despite the rejection from the $111K level, the overall structure remains bullish with price still holding above the ascending trendline and moving averages. As long as the asset remains above the $91K demand zone, the buyers are still in control structurally. If the FVG gets filled and the reaction is strong, it could create a new higher low and set the stage for another attempt toward the $111K–$114K resistance zone.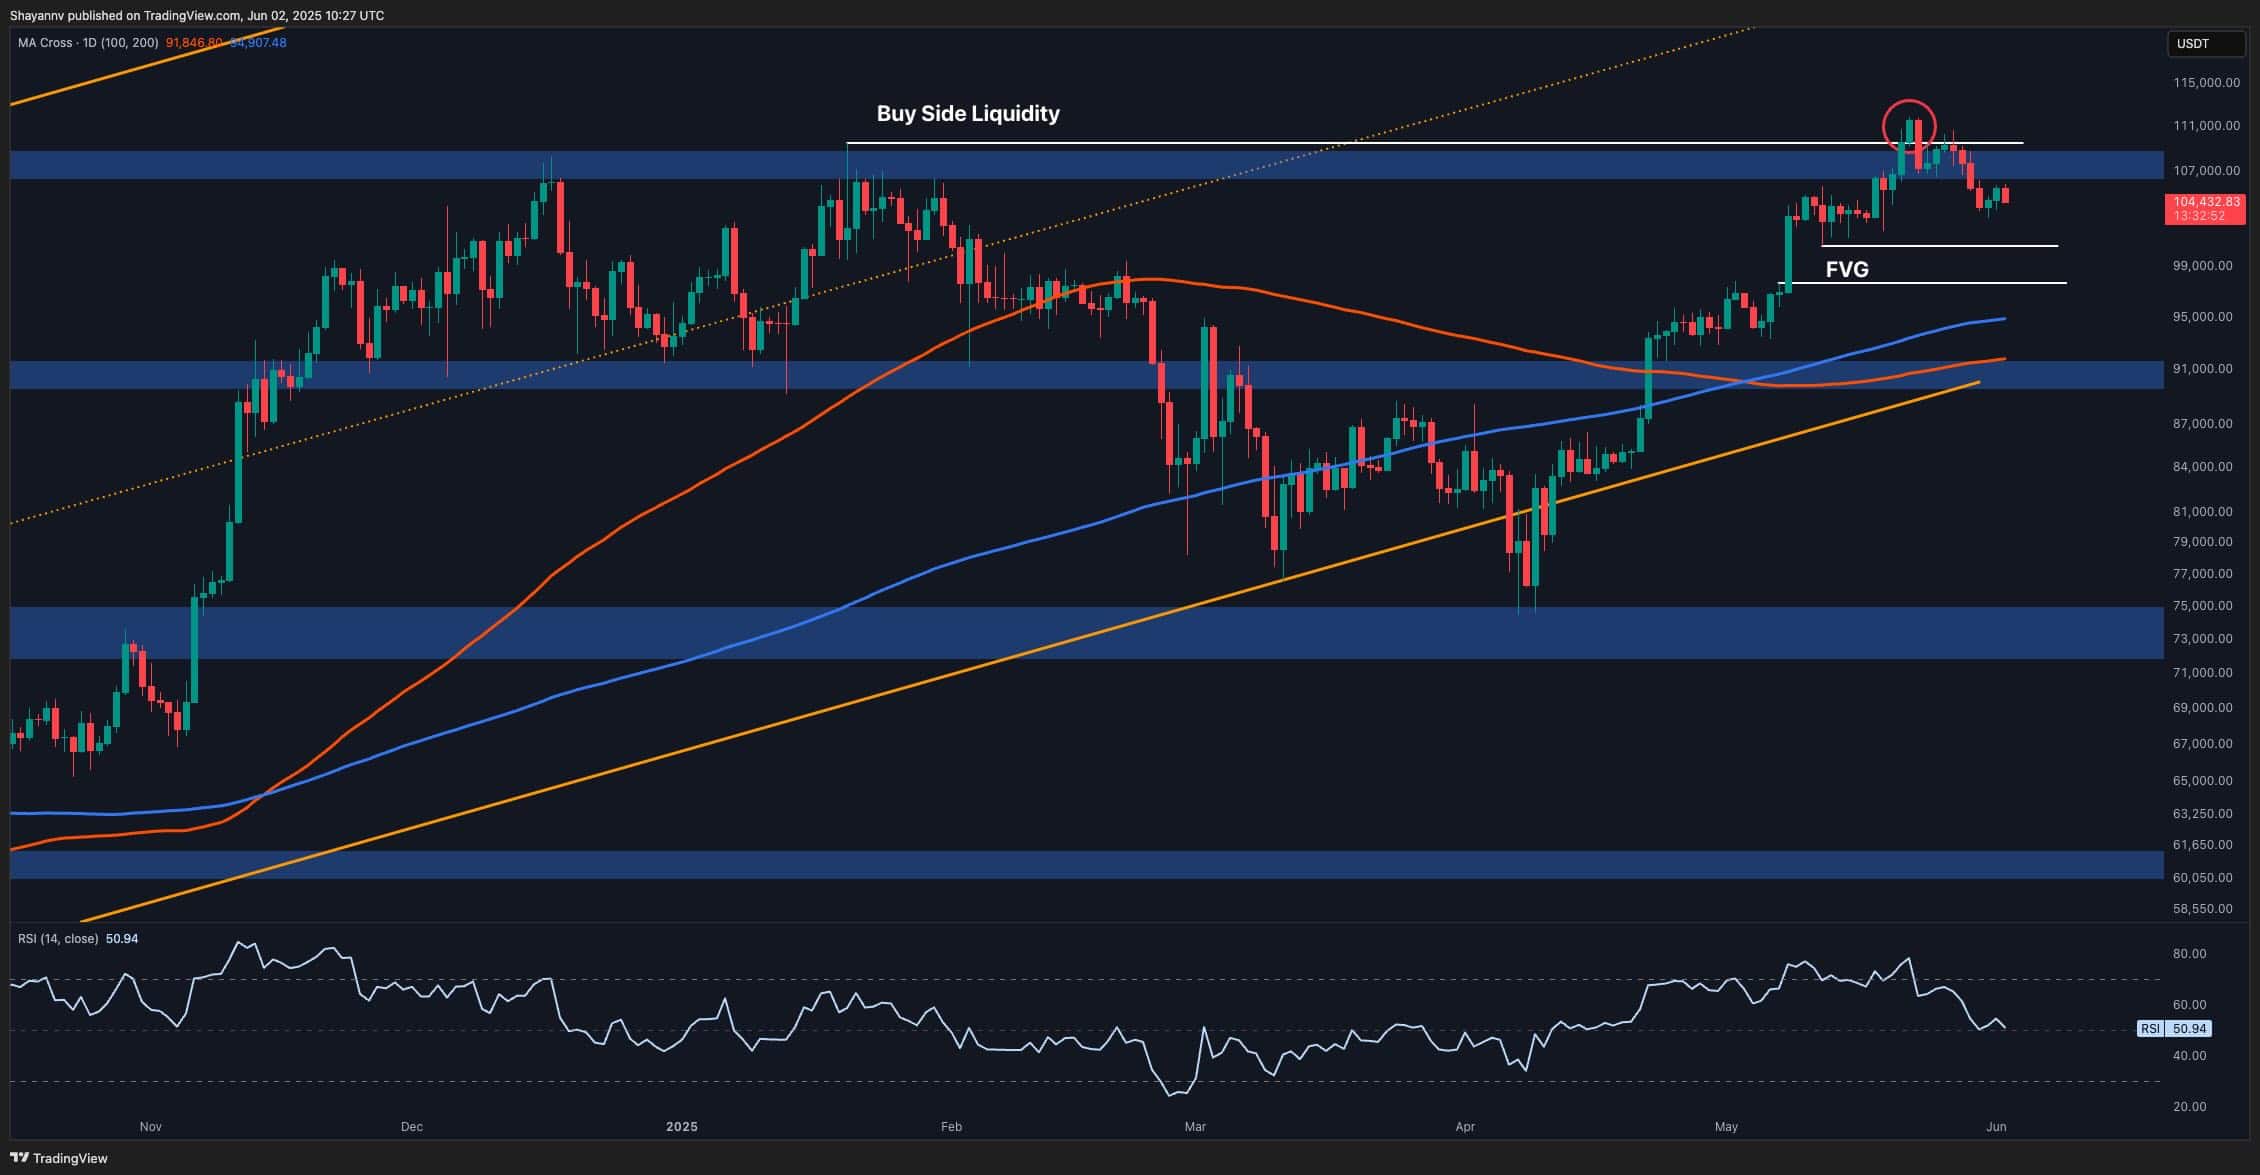
The 4-Hour Chart
Zooming into the 4H chart, BTC has broken below the ascending channel that had guided price action since early April. The breakdown was followed by a rejection from the $108K zone, suggesting that previous support has now turned into resistance.
Moreover, the RSI on this timeframe is slightly below 50, pointing to bearish momentum gaining ground. There is also a clear range forming between $102K and $108K, with the price oscillating within it after the initial sell-off.
Short-term traders should pay close attention to the mid-range and the recent swing lows NEAR $102K. A break below this level could trigger a sharper move toward the $100K support level.
On the flip side, reclaiming the $108K mark could invalidate the short-term bearish setup and open the doors for a retest of the range high and possibly $111K again. However, as things stand, the market is likely to go through a deeper correction in the coming days.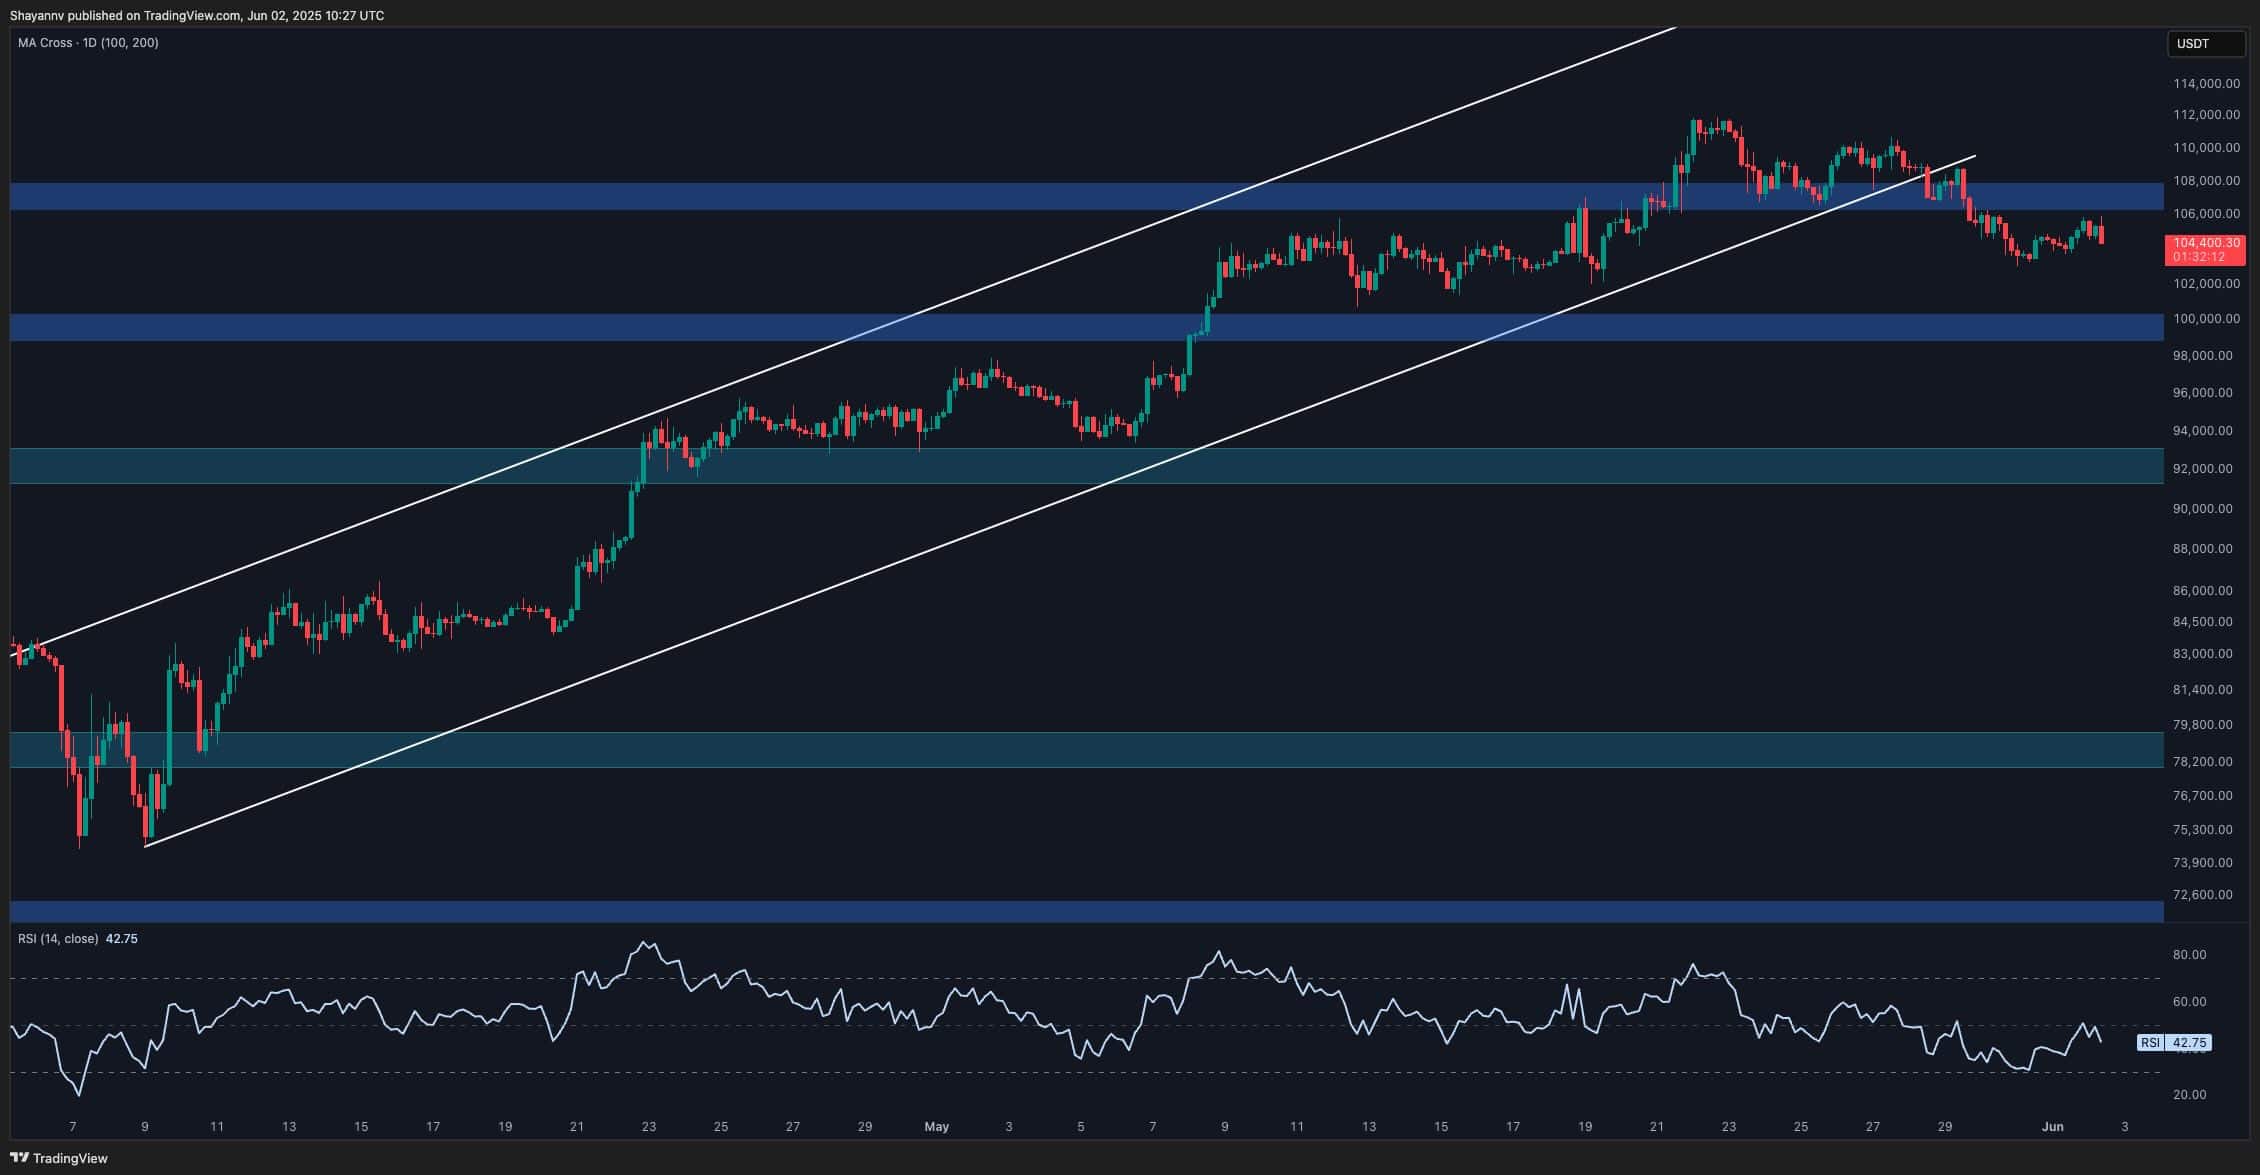
On-Chain Analysis
Adjusted SOPR (30-day EMA)
The 30-day exponential moving average of Bitcoin’s Adjusted SOPR (aSOPR) has been on the rise well above the 1.0 threshold, indicating that, on average, coins moving on-chain are doing so in profit.
This generally reflects renewed investor confidence, as holders become more willing to sell at a profit rather than capitulate at a loss. Historically, sustained aSOPR values above 1.0 during uptrends support bullish continuation, especially when price corrections are shallow.
However, the current reading also suggests the market is entering a more sensitive phase. When the aSOPR rises too aggressively, it often precedes local tops as short-term holders rush to realize profits. A healthy trend WOULD see a slight aSOPR reset above 1.0, ideally aligning with a price pullback into a support zone, before the next leg up.
