Ethereum Bulls Charge Toward Key Resistance—Will ETH Smash Through or Face Rejection?

Ethereum’s rally faces its first real test as it approaches major resistance levels. Traders are split—will ETH mirror its 2021 bull run, or is this another ’buy the rumor, sell the news’ setup courtesy of Wall Street’s crypto tourists?
Technical indicators show bullish momentum, but the $4,200 zone looms large. A clean breakout could trigger FOMO buying, while rejection here might see profit-taking from the same institutional players who still think blockchain is a spreadsheet upgrade.
The smart money’s watching volume closely. Weak hands need not apply.
Technical Analysis
By ShayanMarkets
The Daily Chart
ETH has hit a technical ceiling just under the $2,900 resistance, which aligns closely with the 200-day moving average. This zone previously acted as a major breakdown point in February and is now serving as a supply area. The RSI also recently entered overbought territory, suggesting that momentum is fading as price approaches this resistance.
A rejection from here could lead to a pullback toward the $2,200 support zone and the 100-day MA located near the $2,100 mark. A confirmed breakout above $2,900 WOULD shift the bias back to bullish, with a potential continuation toward the critical $4,000 zone.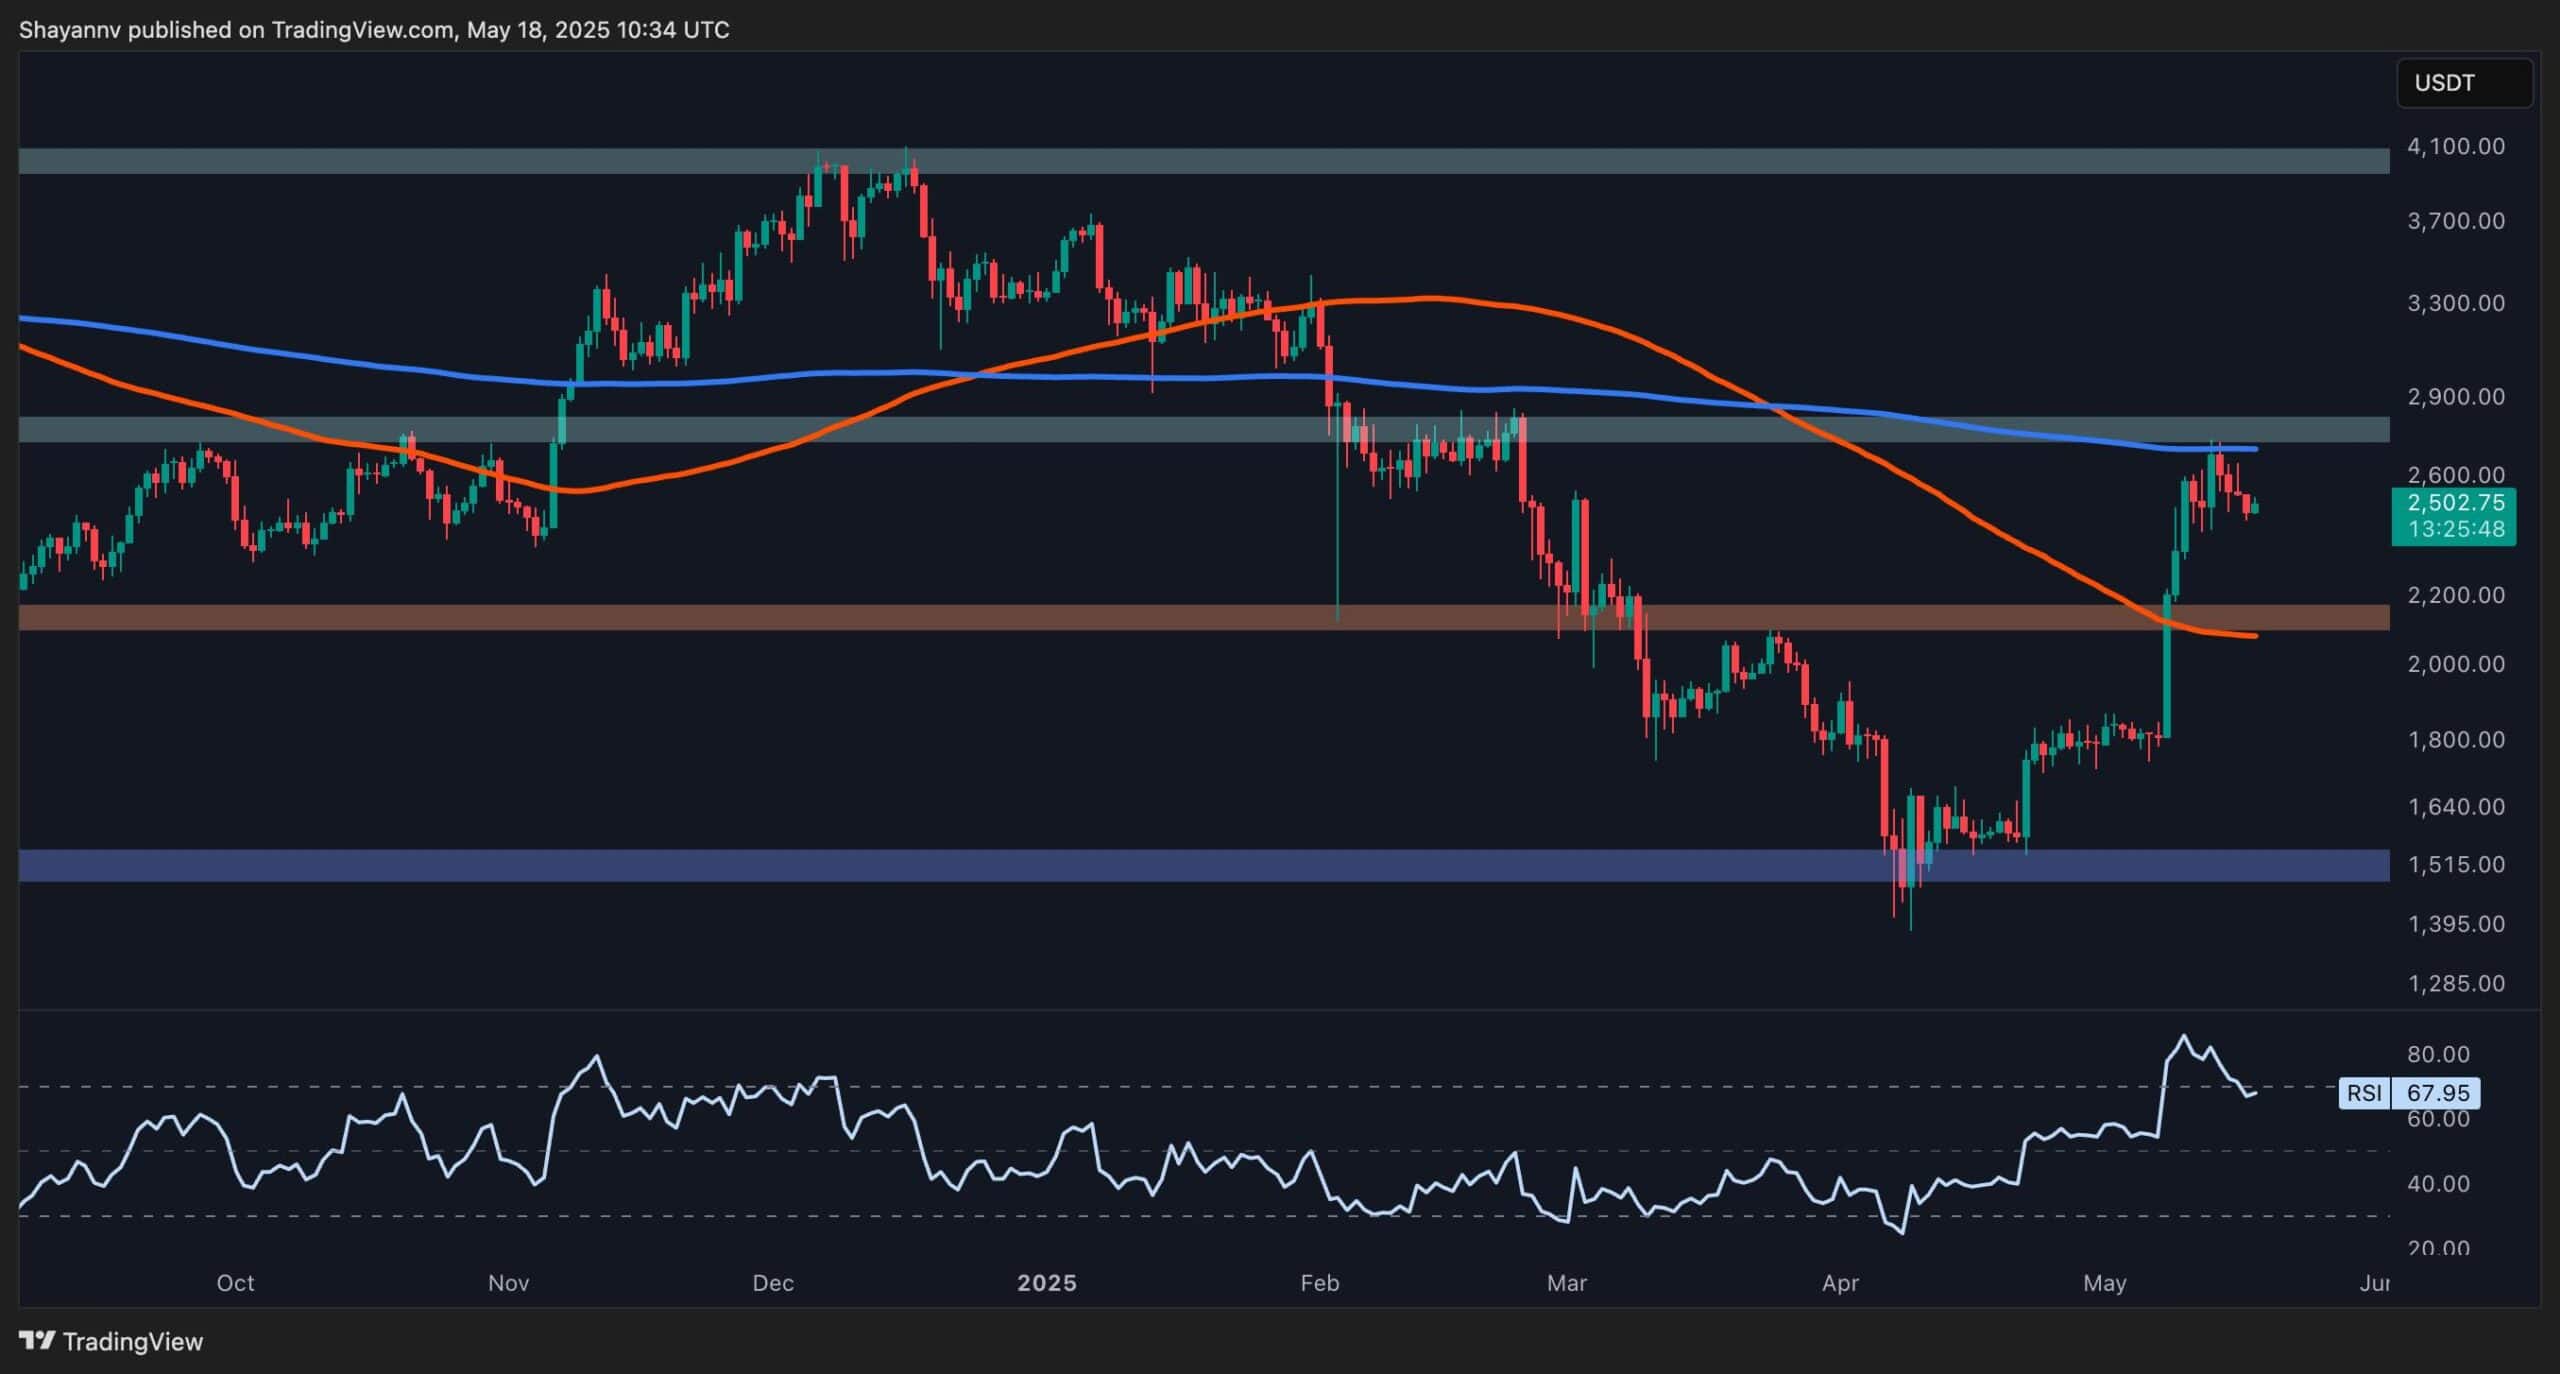
The 4-Hour Chart
Dropping lower on the 4-hour timeframe, ethereum is showing signs of weakening momentum. After the explosive move above $2,100, the price has been consolidating within a narrow range near the $2,500–$2,600 region.
A clear bearish divergence is now confirmed on the RSI, with price making higher highs while RSI makes lower highs. This typically indicates a potential correction ahead. If ETH loses the $2,450 support, a retracement toward $2,200 and even $2,050 becomes likely. On the flip side, reclaiming $2,600 with strong volume could invalidate the bearish signals and open the path for a run at the $3,000 area.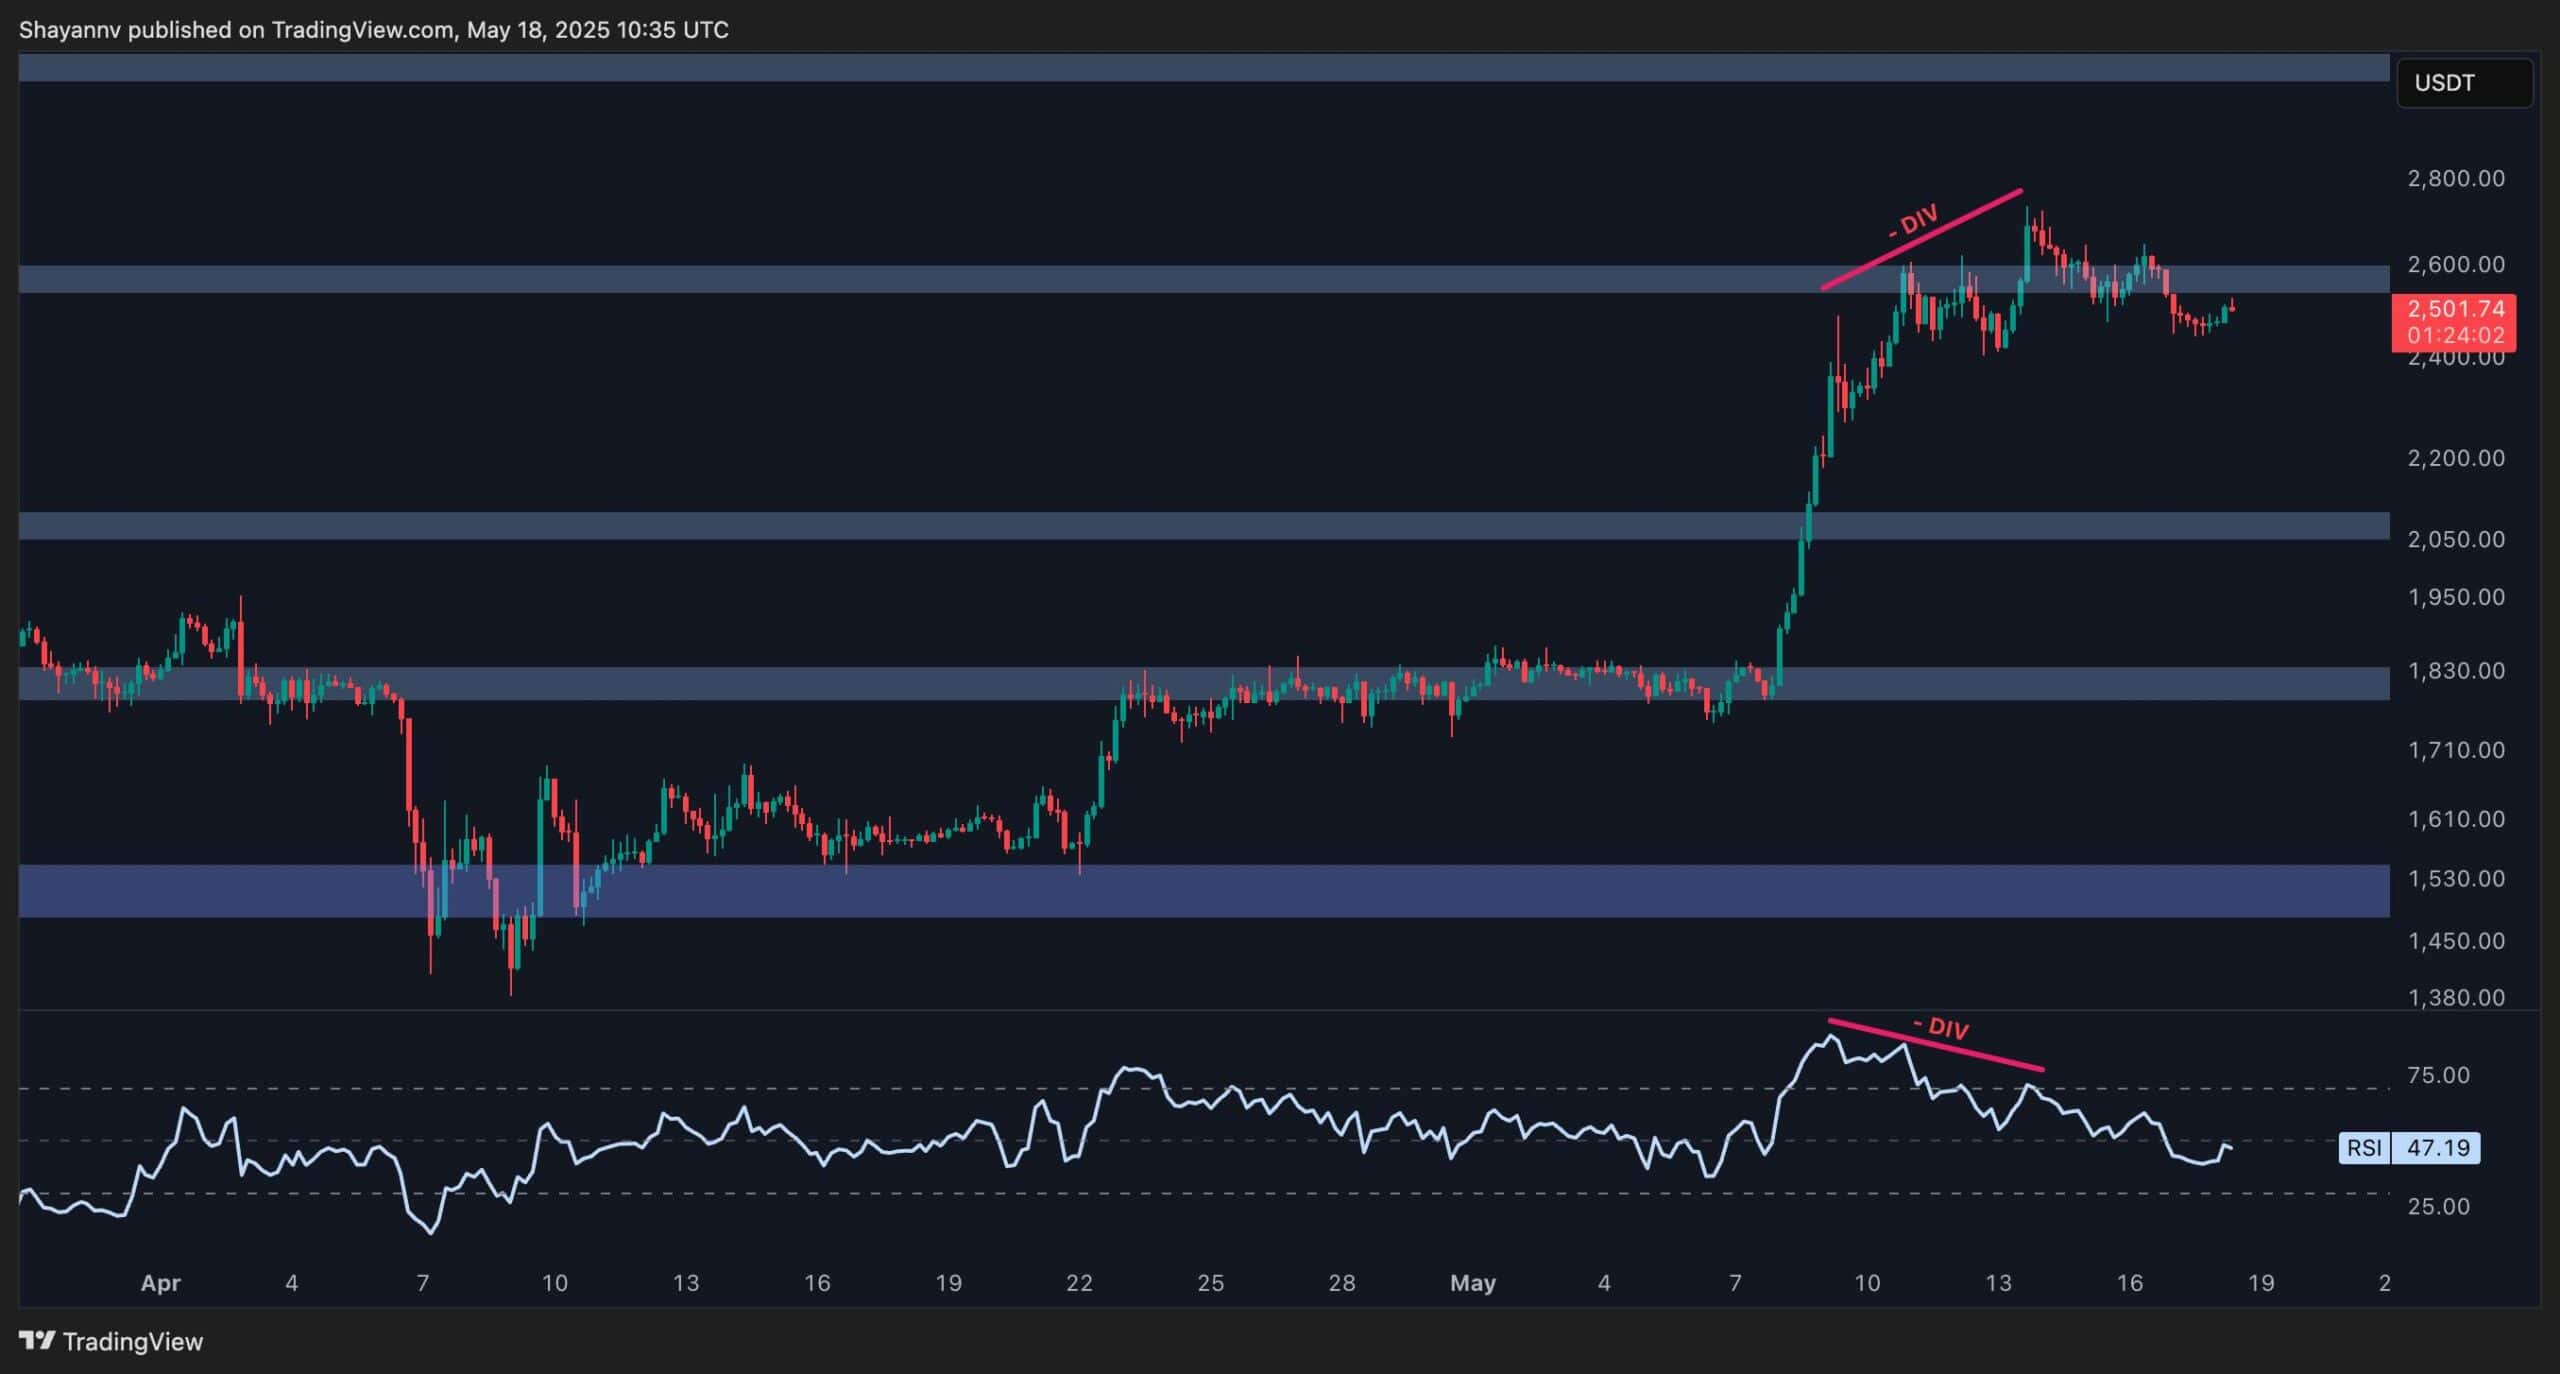
Sentiment Analysis
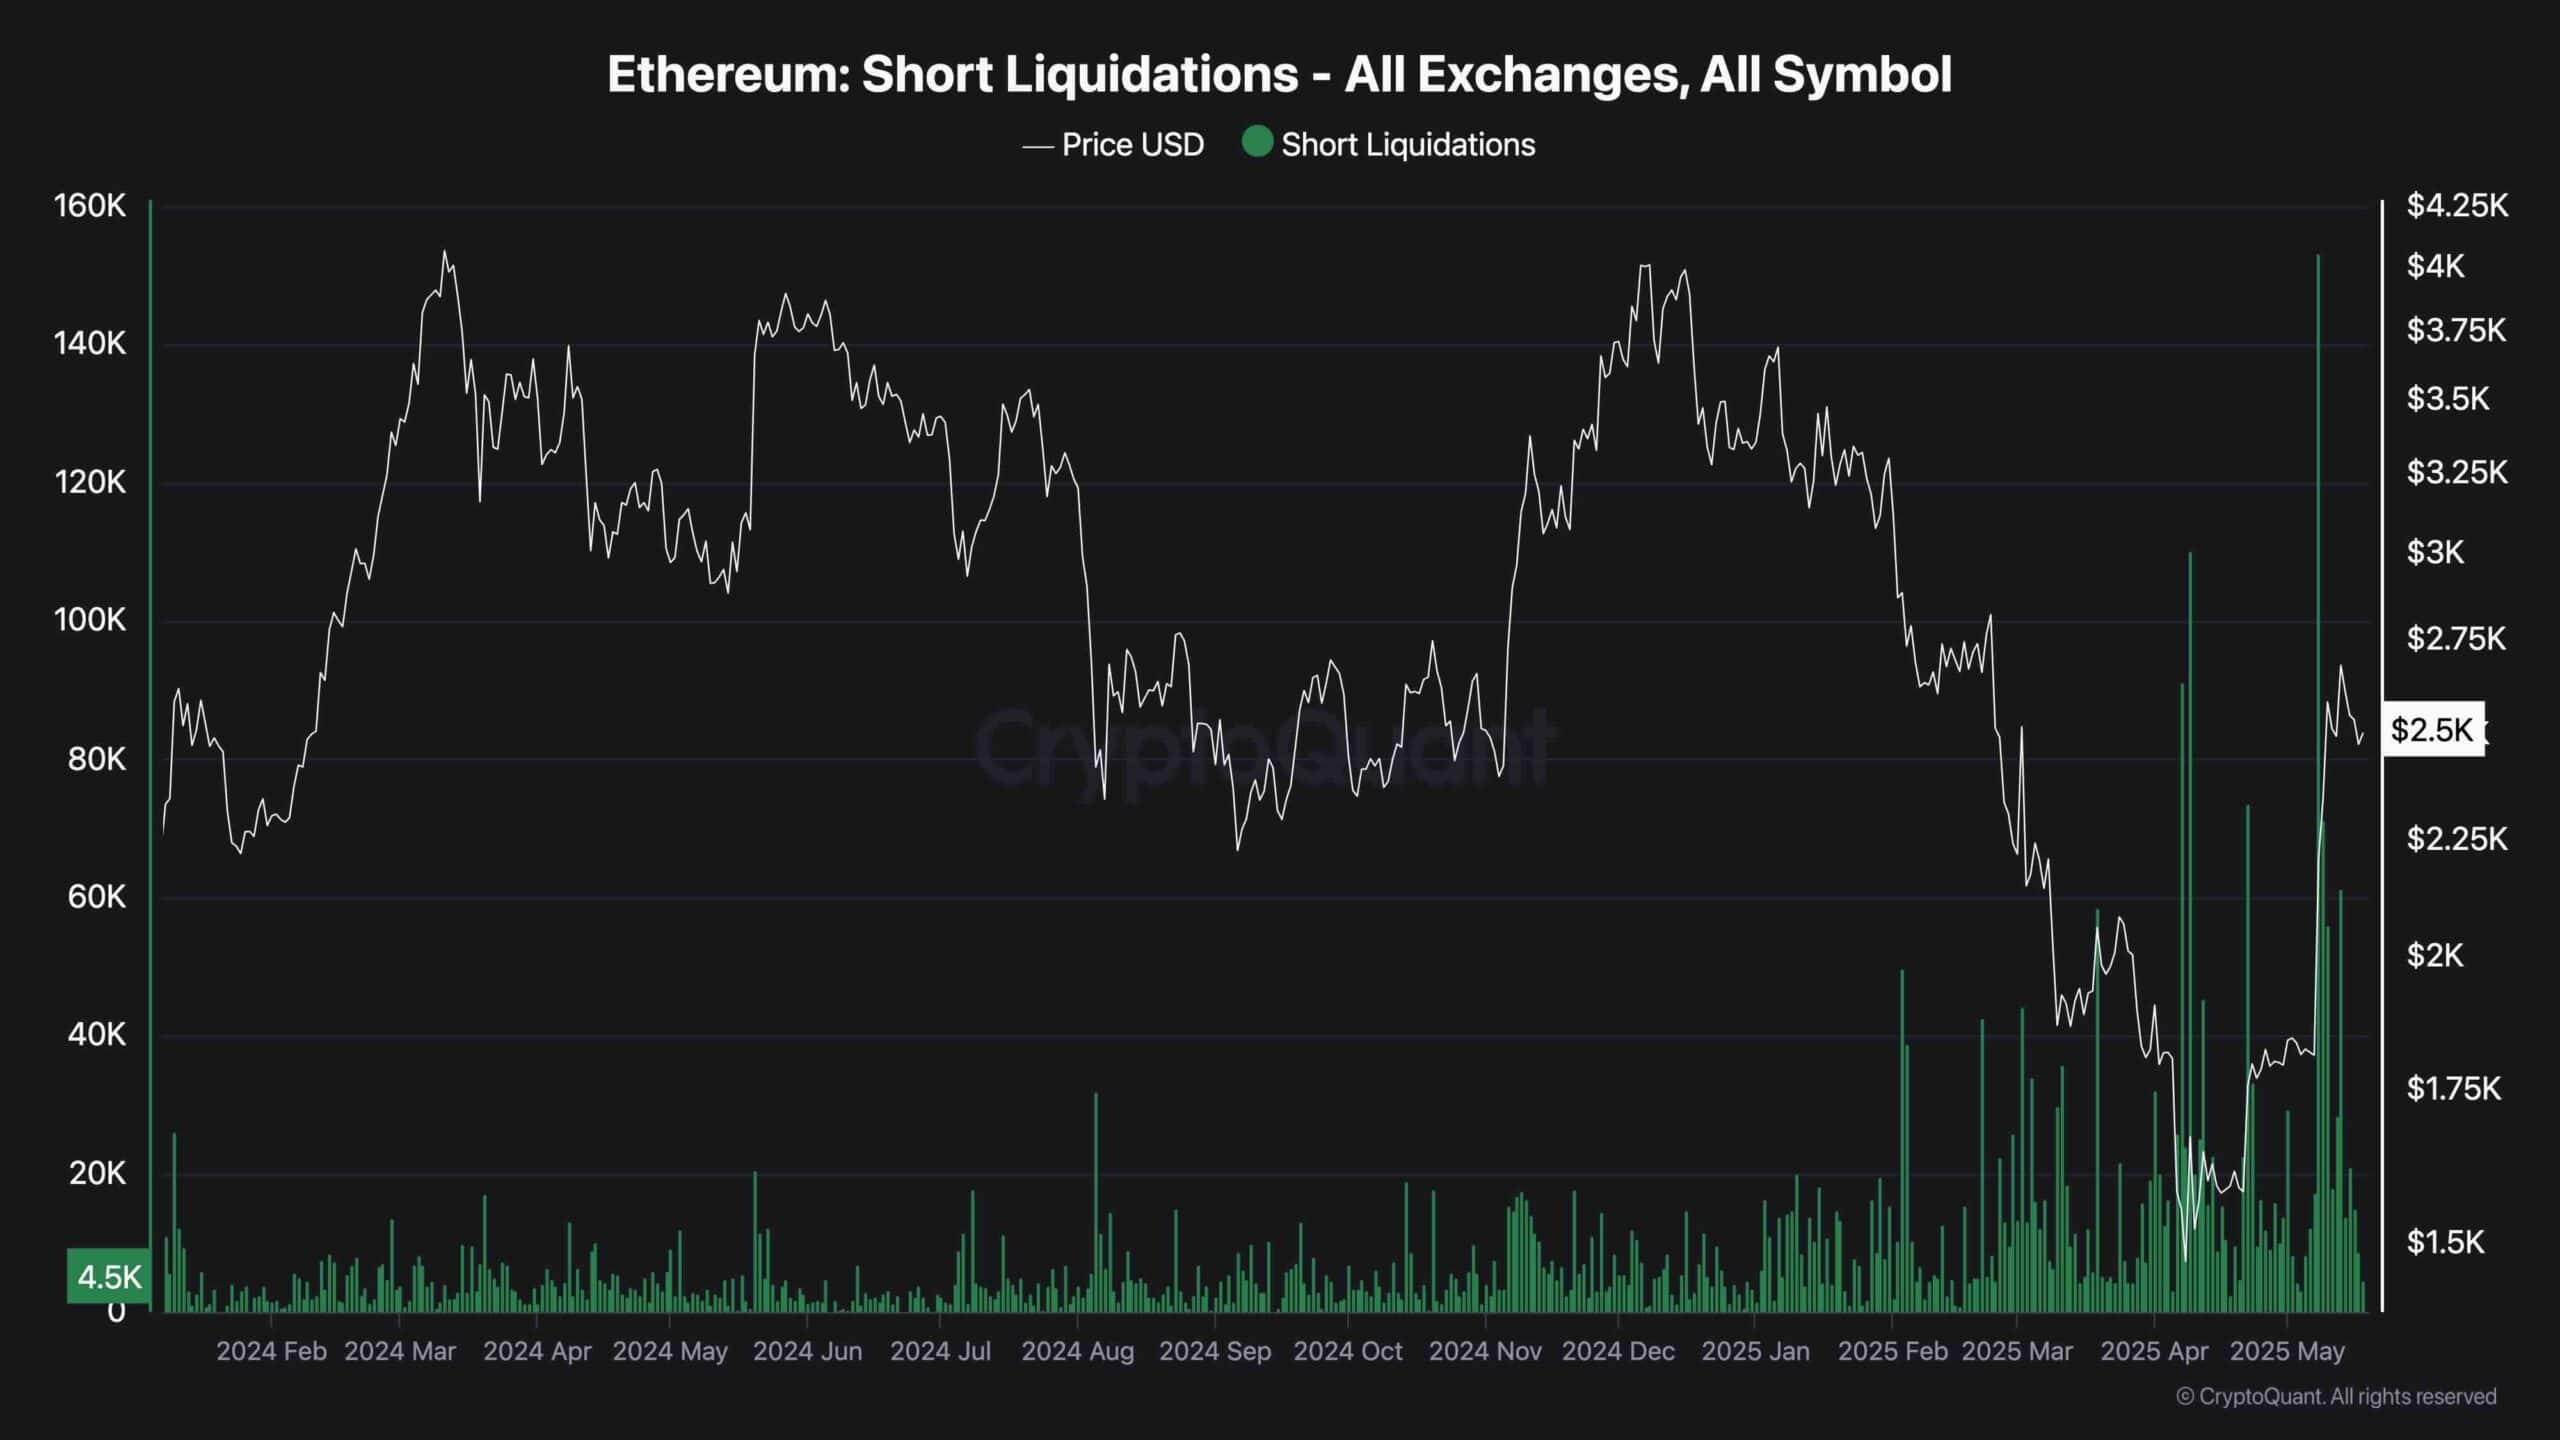
The recent rally triggered a sharp wave of short liquidations, which helped fuel the aggressive price surge. As seen in the short liquidation chart, the largest liquidations occurred NEAR $2,400–$2,600, signaling a large portion of sellers were forced out of the market. This typically leads to short-term cooling, as the “fuel” for the rally gets exhausted.
The liquidation chart shows a clear uptick in forced closures over the past week, aligning with Ethereum’s breakout. These spikes often mark local tops, as the removal of excessive short exposure removes the momentum driver. With liquidations now tapering off, the price may struggle to push higher without fresh demand entering the market. This context reinforces the idea that ETH could consolidate or correct before any meaningful continuation.