Bitcoin’s Tightrope Walk: Is the Consolidation About to Snap?

BTC’s price has been stuck in a maddening sideways grind—but the charts whisper of an impending breakout. Here’s what the tape says.
The Squeeze Before the Storm
Bollinger Bands tighter than a Wall Street banker’s grip on fees. Volatility at historic lows. This isn’t calm—it’s a coiled spring.
Whale Watching Season
On-chain data shows accumulation patterns mirroring early 2023. Meanwhile, futures open interest creeps up while retail snoozes—classic smart money vs. dumb money divergence.
Macro Winds Shifting
The Fed’s rate-cut pantomime might finally matter less than Bitcoin’s halving math. Miners are hodling like it’s 2020 again, and exchange reserves keep bleeding dry.
One thing’s certain: When this consolidation breaks, it’ll move fast—just like that ’stablecoin’ your broker swore was risk-free. Place your bets.
Technical Analysis
The Daily Chart
Bitcoin remains in a consolidation phase after failing to reclaim the key $108K resistance zone. This price behavior suggests that profit-taking is occurring at this crucial level, increasing selling pressure and triggering a mild retracement. However, Bitcoin still exhibits strong bullish momentum, evidenced by its recent impulsive moves toward this resistance.
As such, once the ongoing consolidation ends, a renewed bullish surge is expected. The price may retrace further toward the key $98K–$100K support range, where new demand is likely to enter and fuel the next rally. This could pave the way for a fresh attempt at a new all-time high in the mid-term.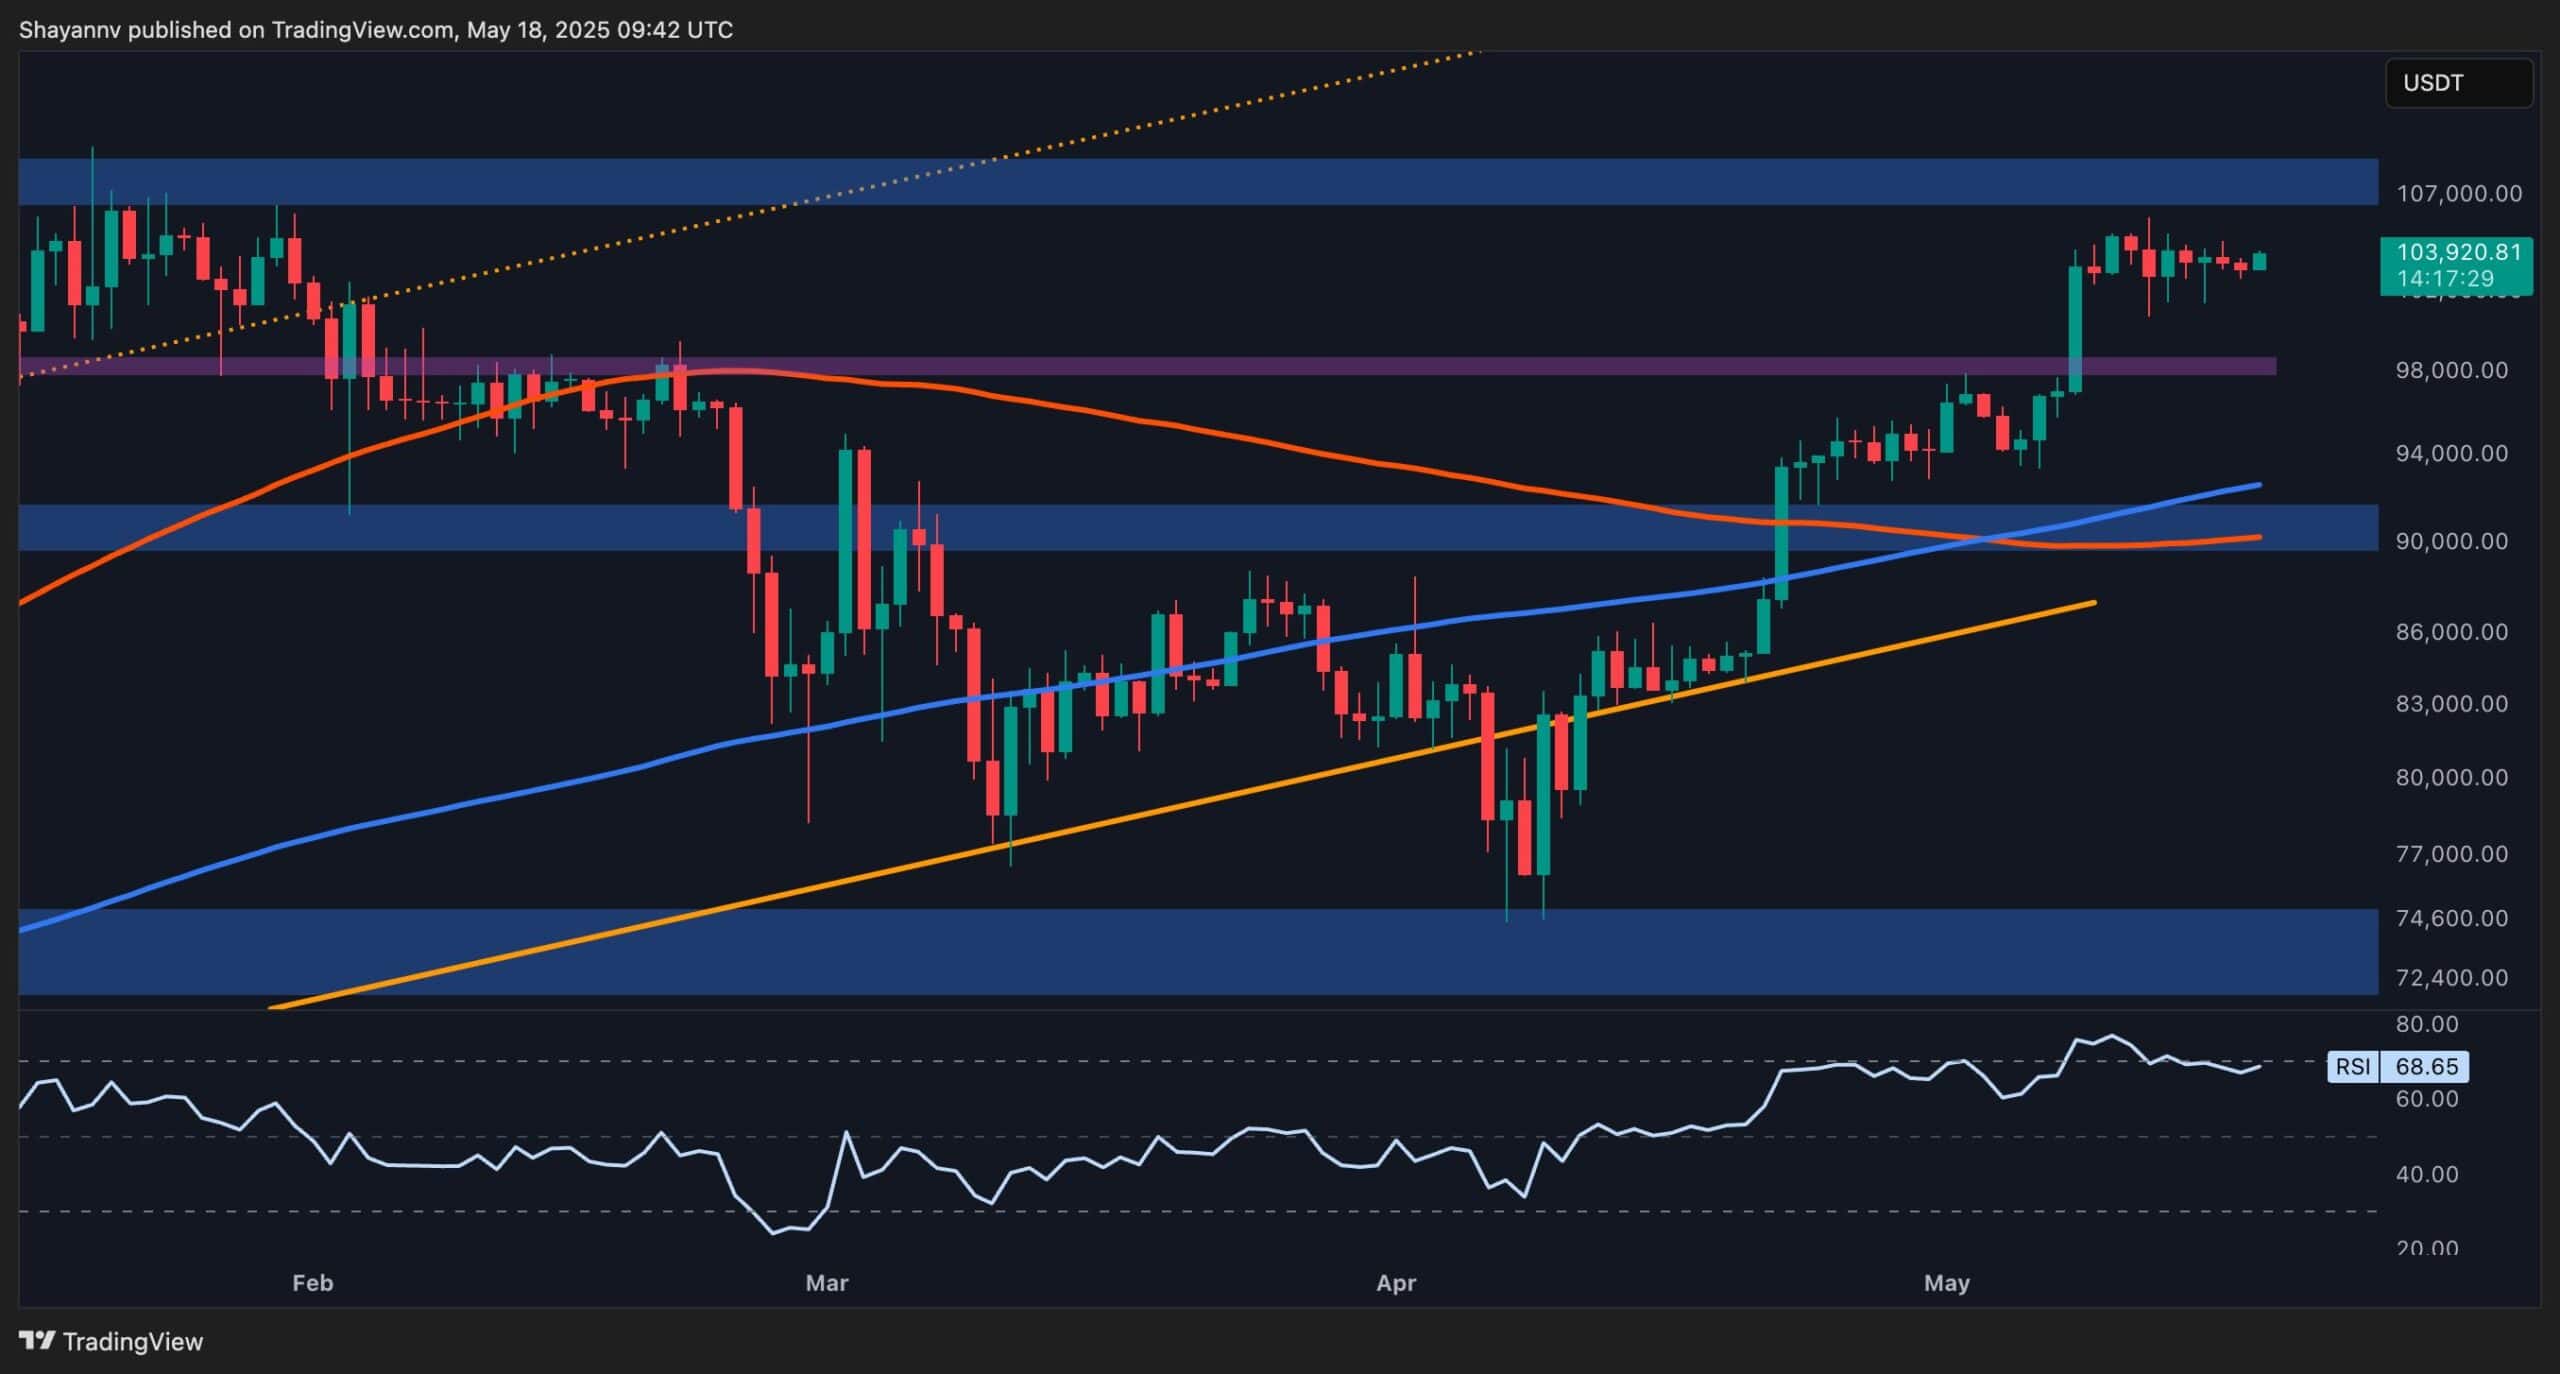
The 4-Hour Chart
In the 4-hour timeframe, BTC continues to trade within a short-term ascending channel, forming higher highs and higher lows—an indication of a bullish structure. The recent consolidation has led to a pullback toward the channel’s lower boundary at $100K, a major psychological support level.
If this support holds, a rapid rebound toward the $109K ATH appears likely. However, if the price breaks below the channel, the consolidation could extend further, with a decline toward the $98K support range becoming the probable scenario.
Ultimately, Bitcoin’s next MOVE hinges on how the price behaves around the ascending channel’s lower boundary.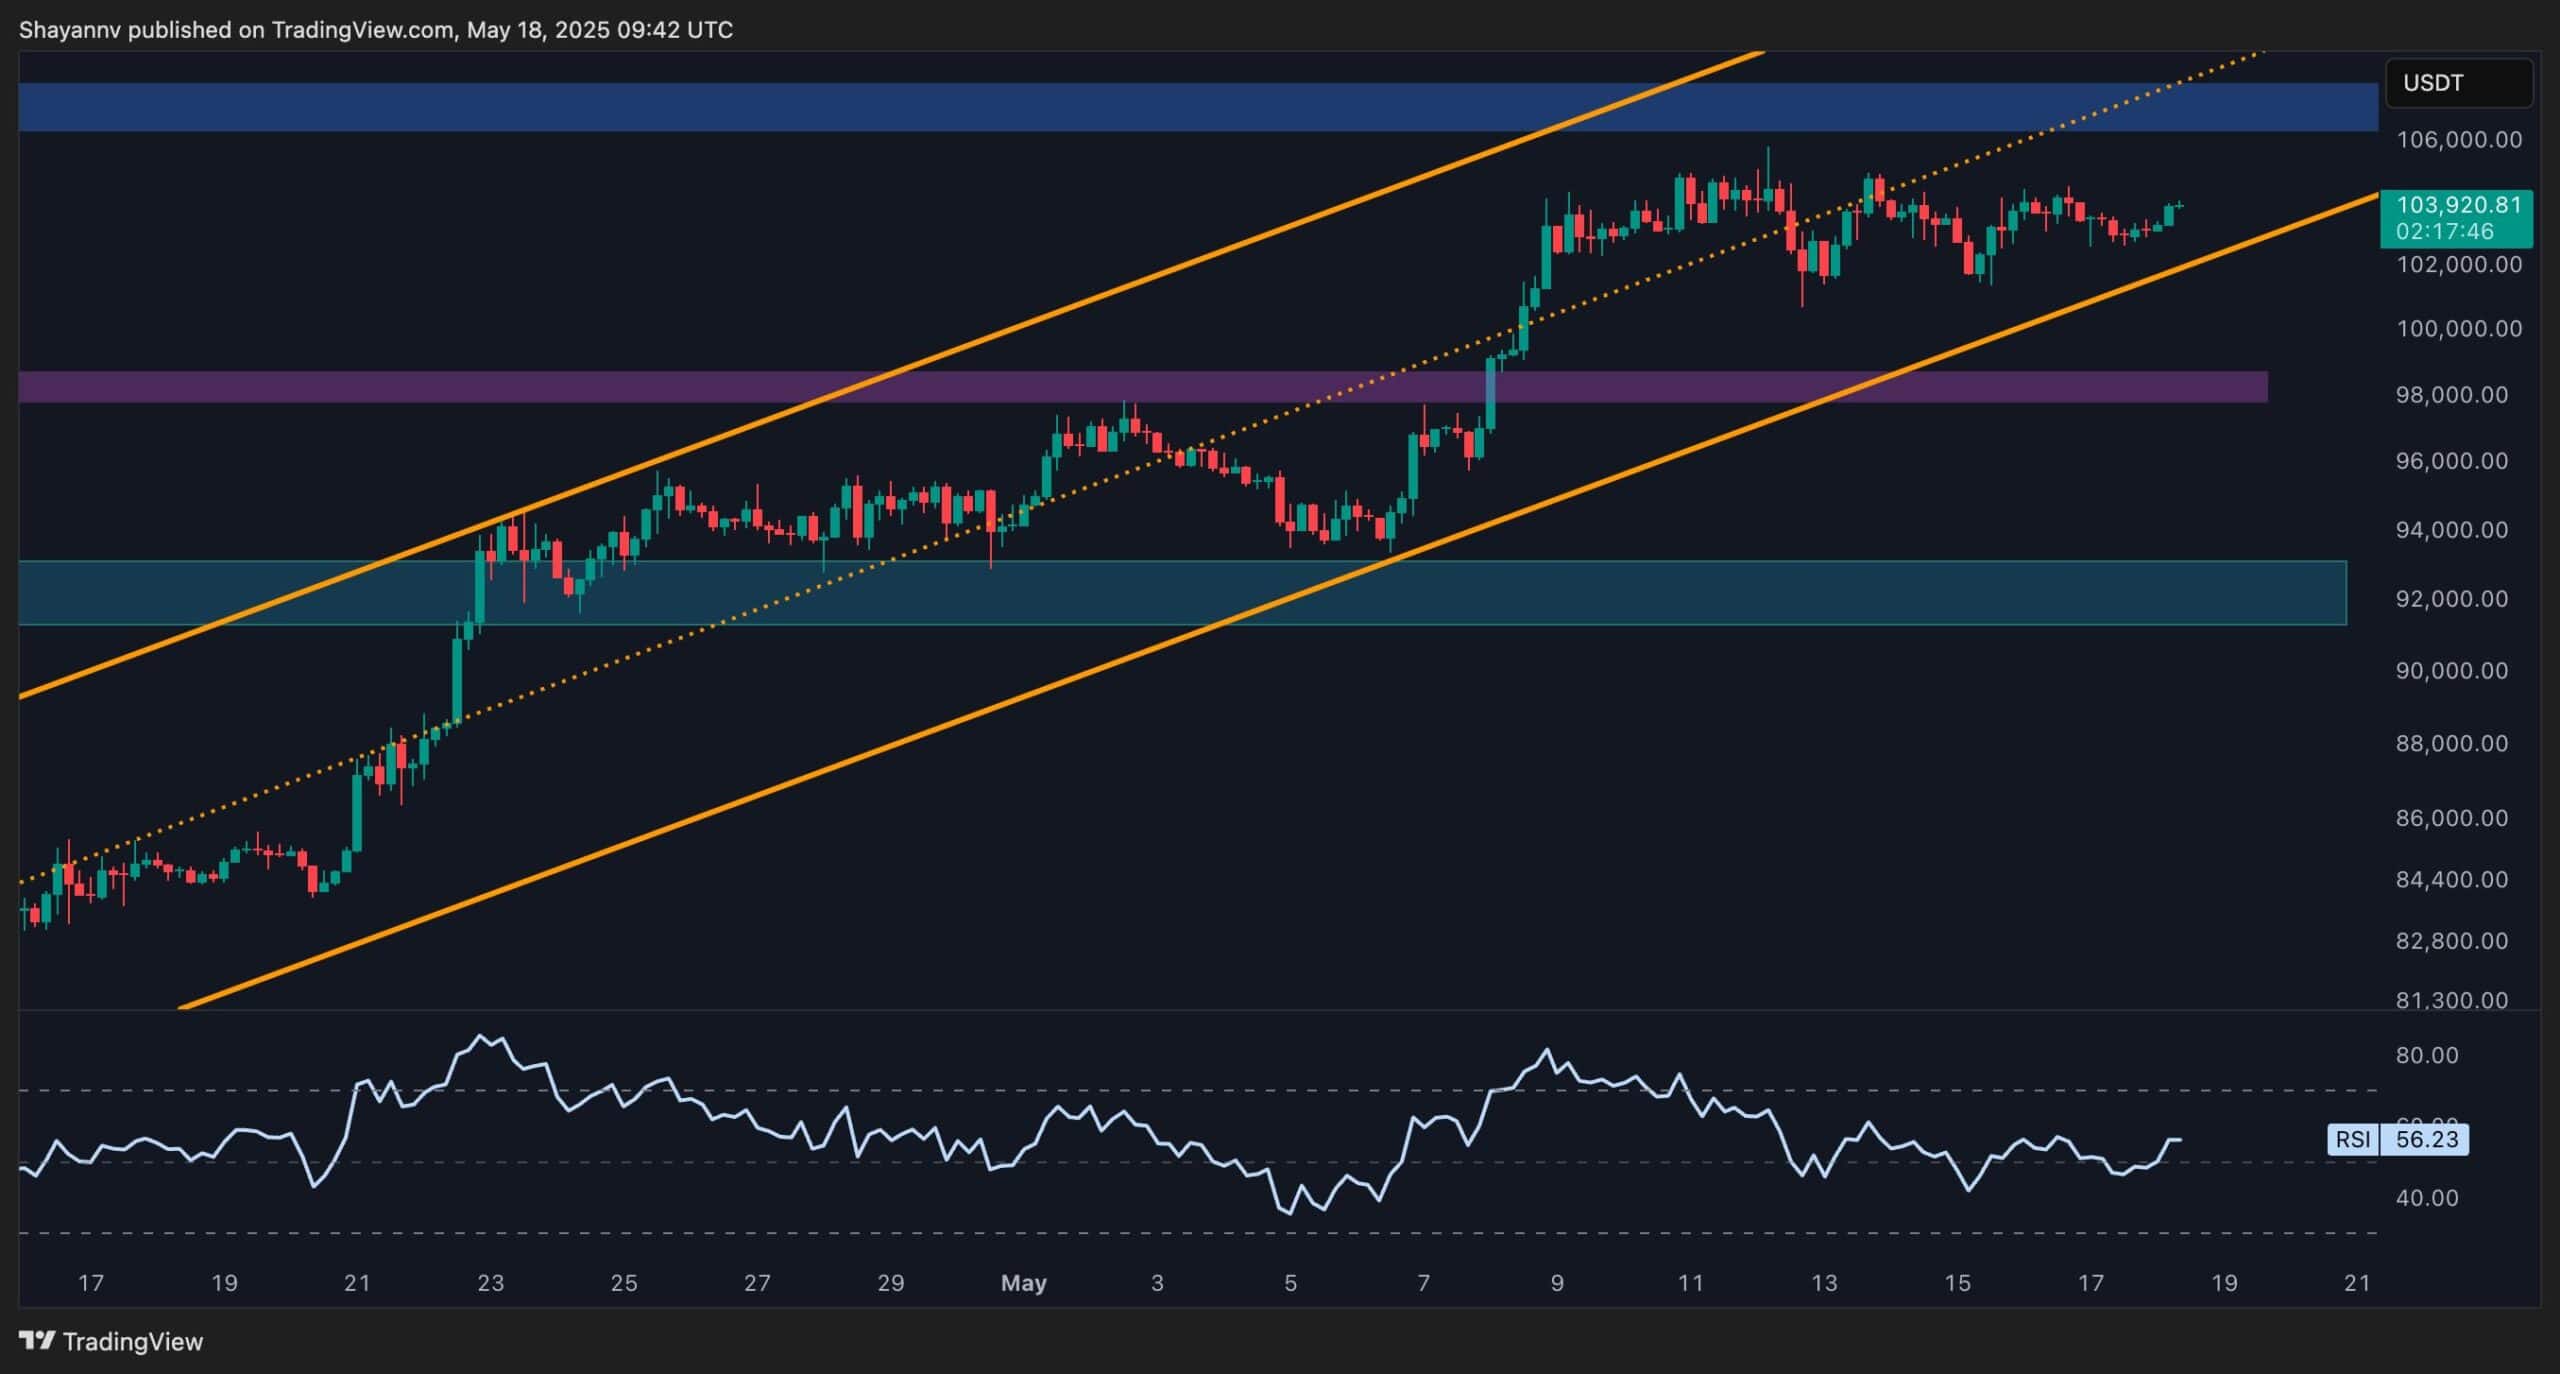
On-chain Analysis
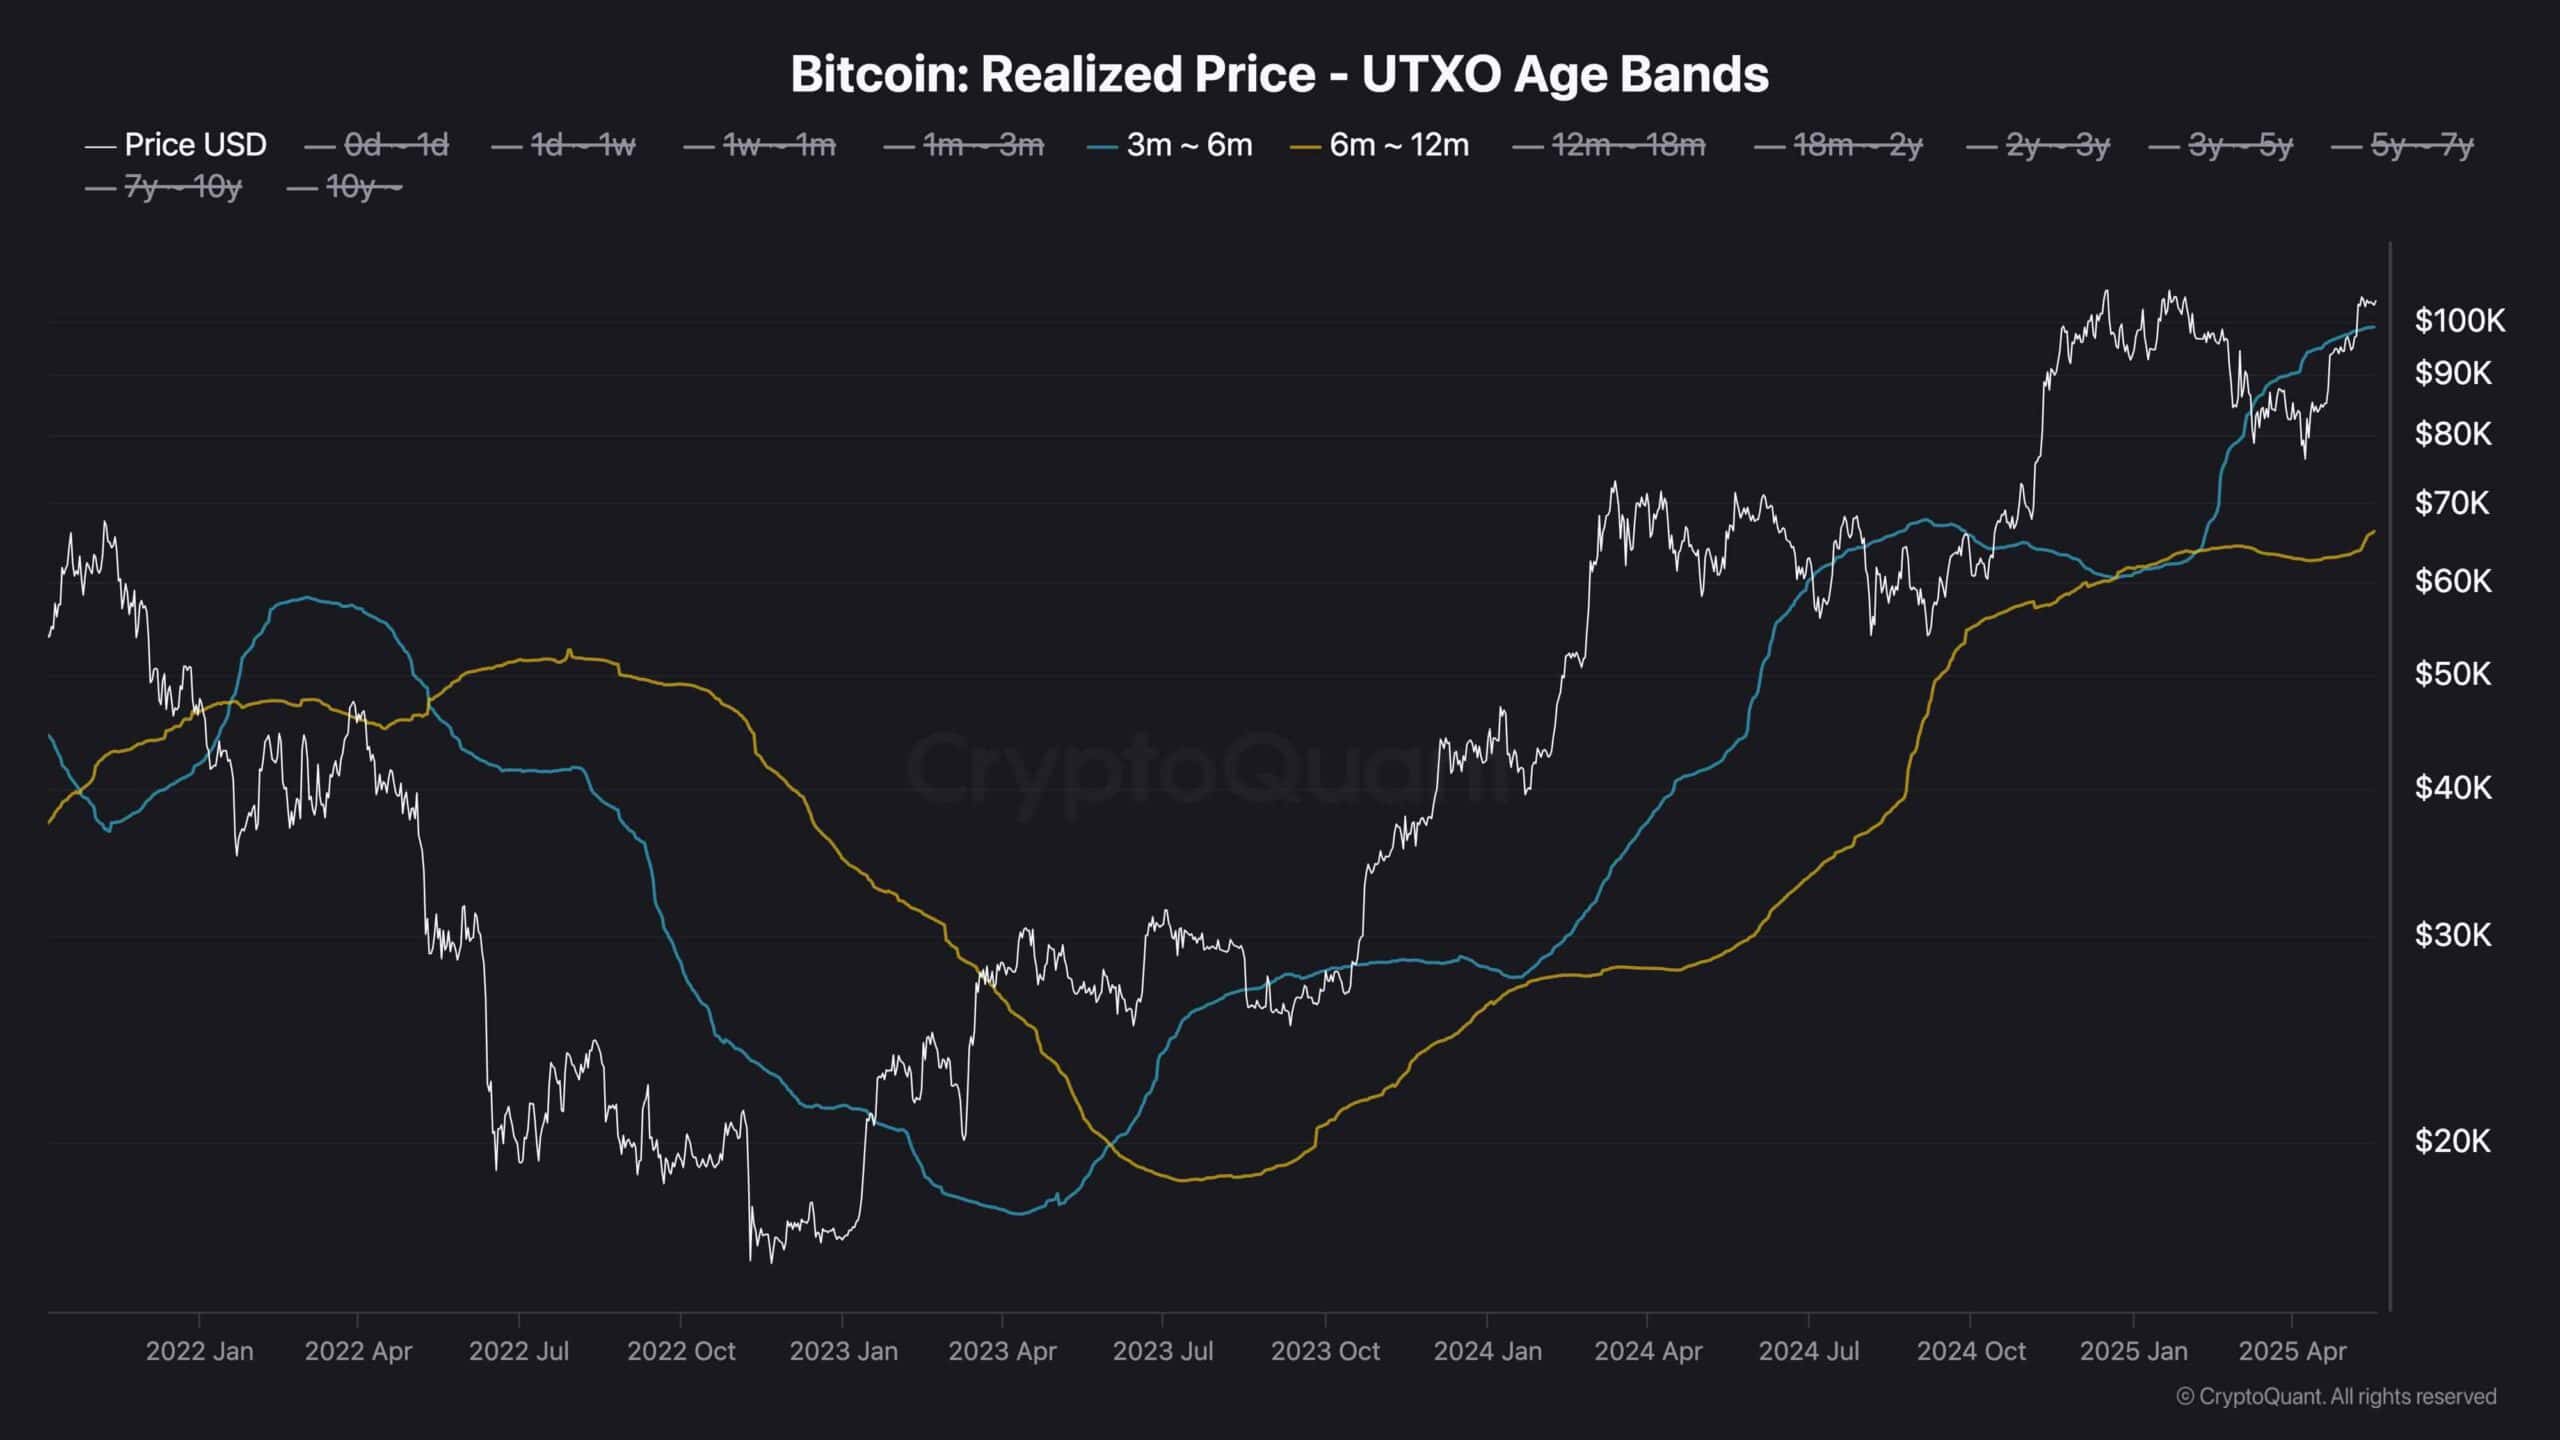
Bitcoin’s interaction with the Realized Price of long-term holders’ UTXOs has historically served as a reliable indicator of market direction, as it reflects the average acquisition cost of these key investors. This metric often acts as a dynamic support or resistance level.
Currently, bitcoin has successfully reclaimed the Realized Price of the 3–6 month holder cohort, suggesting that these important market participants are now in overall profit. This development is typically seen as a bullish signal.
However, a short-term corrective retracement toward this level, currently around $98K, remains a likely scenario, as the market consolidates and searches for fresh demand. The $98K zone stands as a critical support range. A strong rebound from this level could confirm it as a solid foundation and potentially ignite a fresh uptrend, aiming for a new all-time high.