Ethereum Eyes $3K: Can ETH Break Resistance or Will Traders Get Rekt Again?

ETH bulls charge toward $3,000—but the path looks messier than a DeFi rug pull. Key levels to watch, institutional whispers, and why this rally smells suspiciously like leverage-fueled deja vu.
Technical breakout or trap? The 200-day moving average just got steamrolled, but on-chain data shows whales playing hot potato with tokens. Meanwhile, Wall Street ’adoption’ talks resurface—right as the SEC delays another ETF decision. Classic.
Technical Analysis
The Daily Chart
ETH has decisively broken above the 100-day moving average, located around the $2,100 area, and is also trying to reclaim the 200-day moving average NEAR the $2,600 mark. Moreover, the RSI is hovering in the overbought territory, signalling that the rally might be overextended in the short term.
Currently, the asset is consolidating just below the lower boundary of the previously broken long-term ascending channel. A daily close above this level WOULD invalidate the idea of a pullback and open the door toward the $3,000 zone, which coincides with a prior supply area. On the downside, the $2,150 zone now acts as solid support and could serve as a potential re-entry point for buyers if the market pulls back.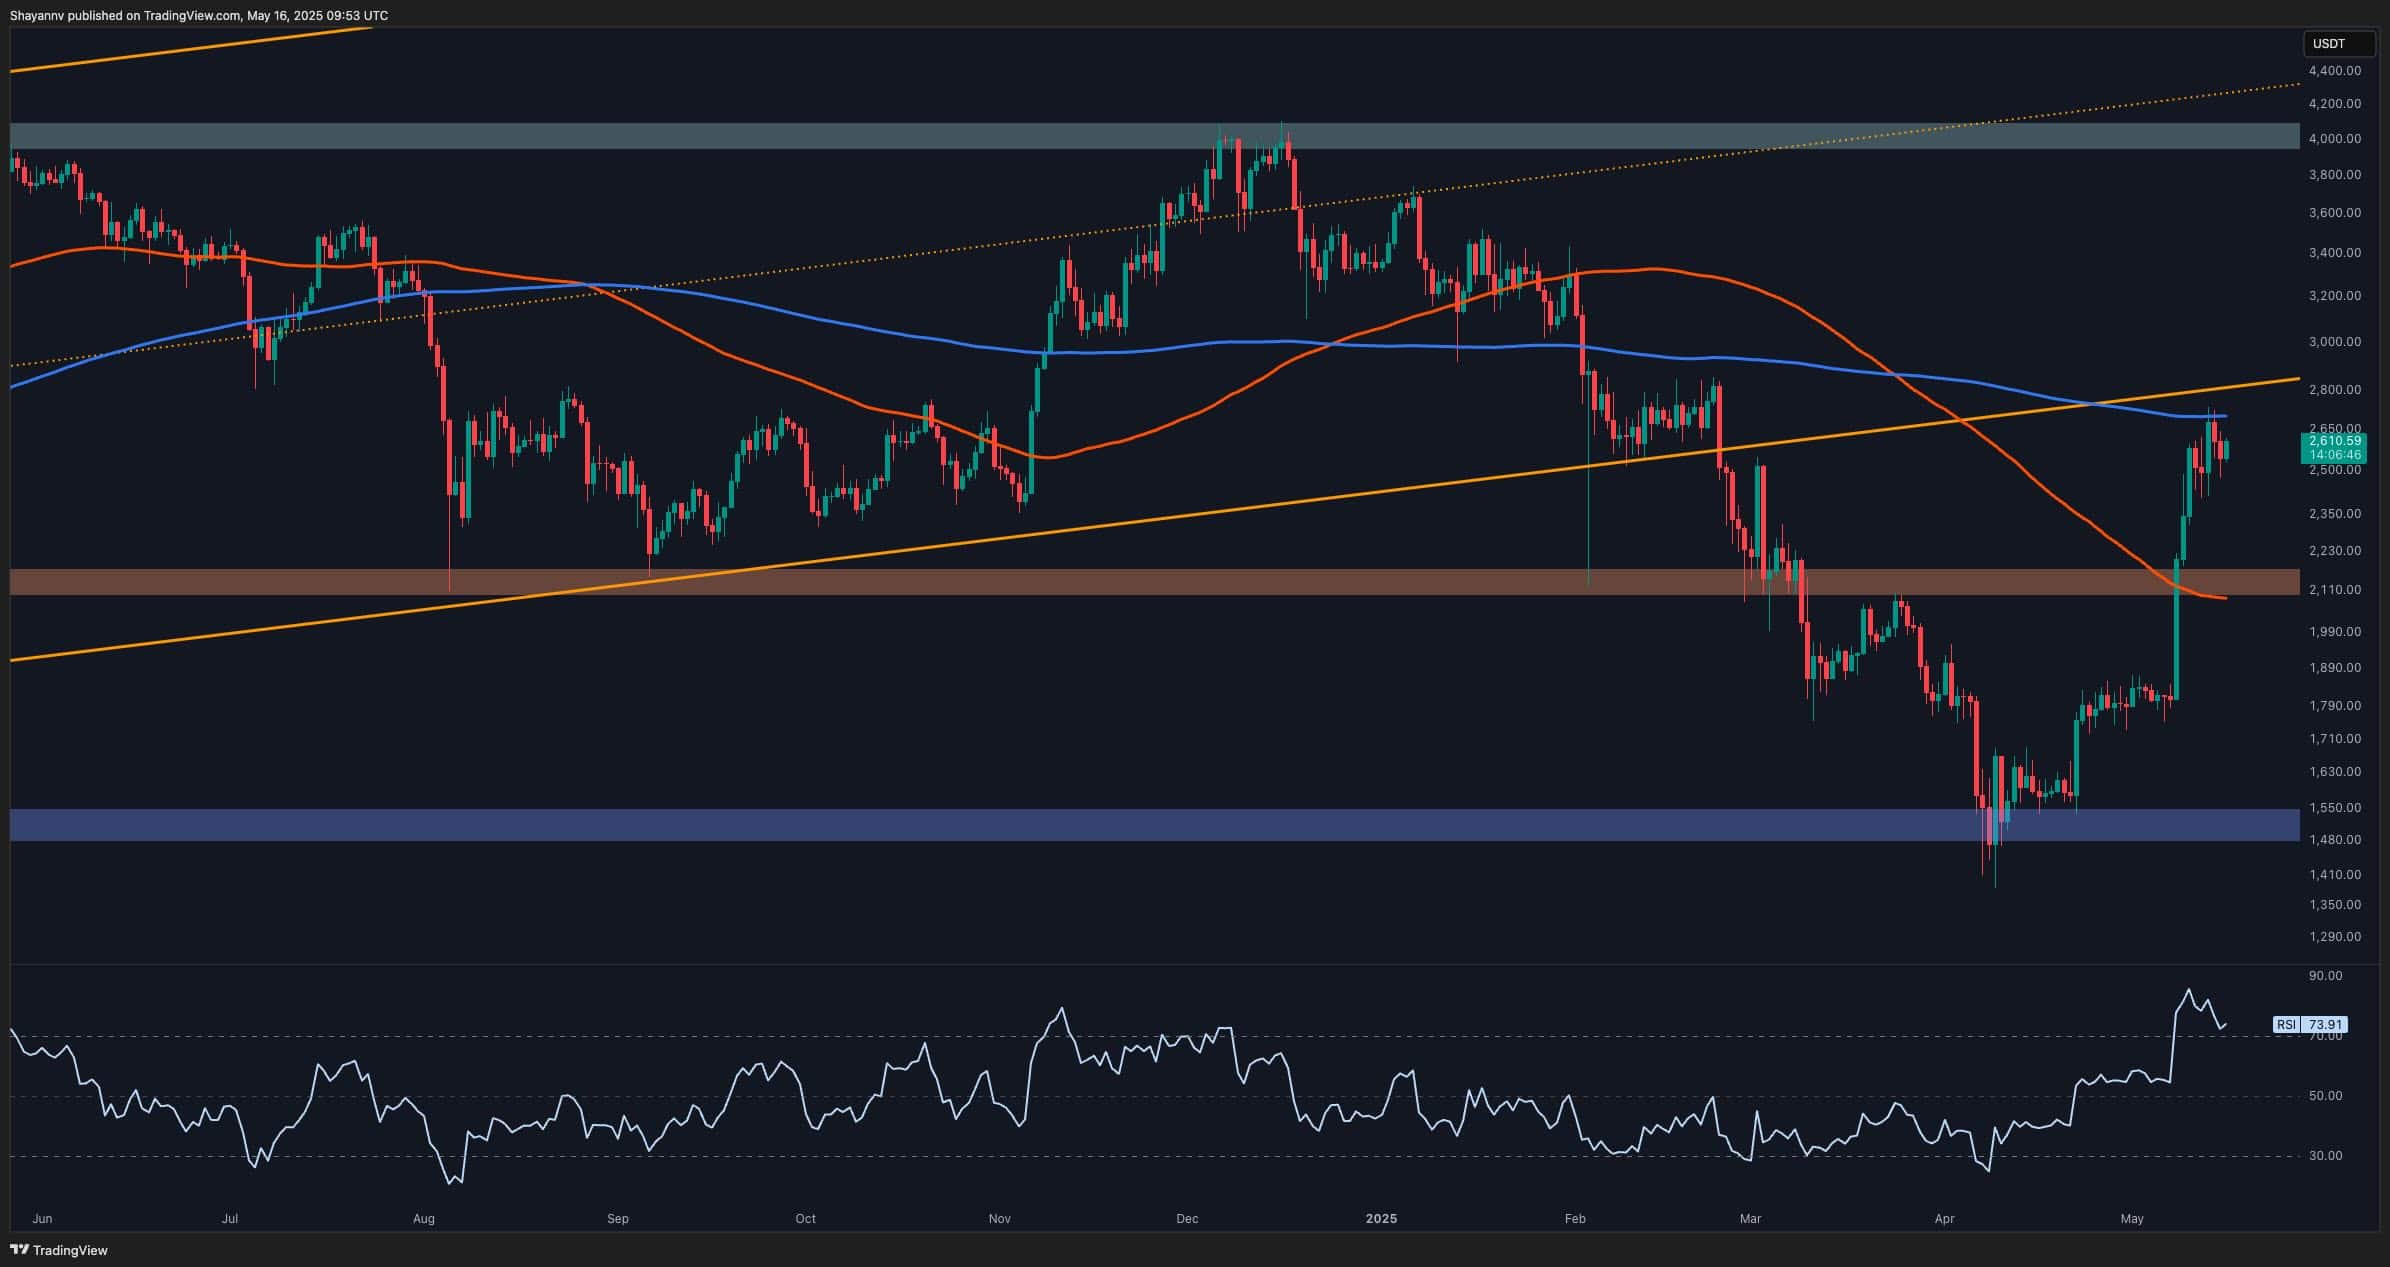
The 4-Hour Chart
The 4-hour timeframe shows ETH consolidating within a narrow range around the $2,600 level. The price is maintaining its gains following the breakout from a descending channel and a series of bullish imbalances filled along the way.
The RSI has also cooled off, showing a decline in bullish momentum but no immediate signs of bearish divergence. If ETH can break and hold above the $2,600 zone, it may gather enough strength to run toward the key $3,000 resistance level soon.
Onchain Analysis
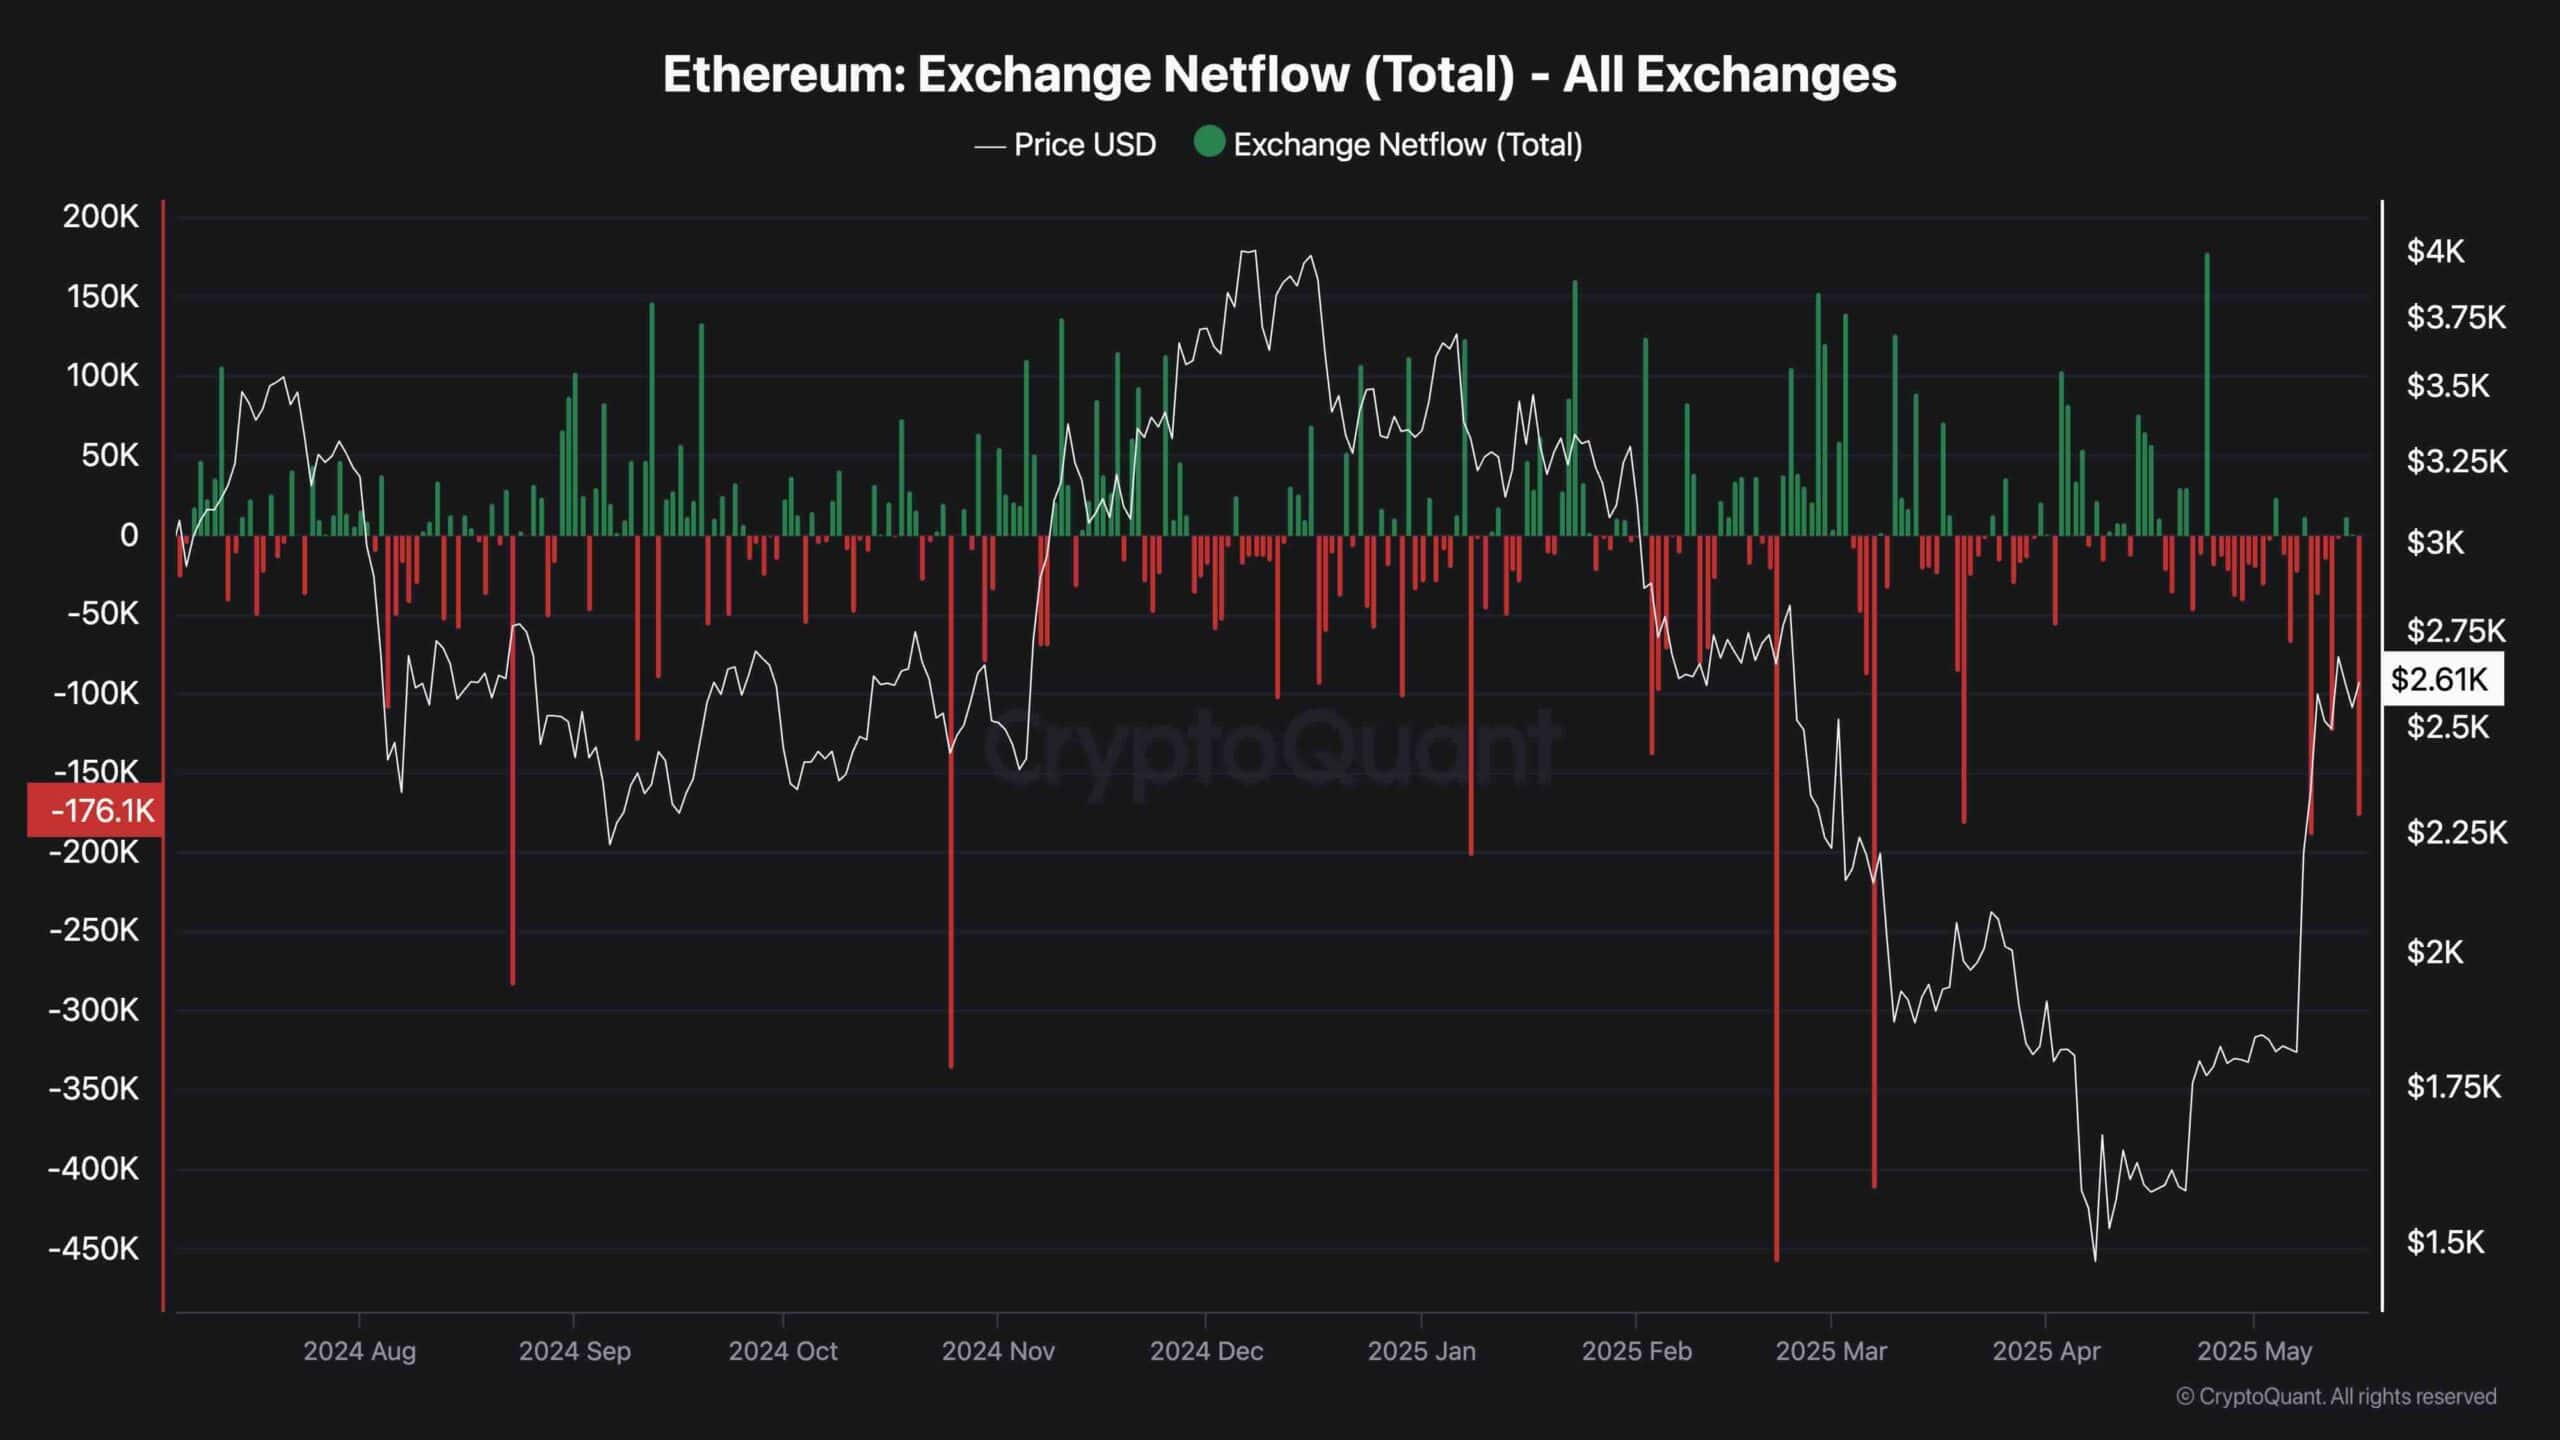
Exchange netflows remain negative on aggregate, with a recent reading showing a net outflow of over 170K ETH. This indicates a broader trend of accumulation and long-term holding, as coins continue to leave centralized exchanges and MOVE into self-custody. Persistent outflows during a price rally typically support the case for bullish continuation as they reflect a lack of intent to sell.
However, it’s worth noting that this behavior also raises caution, as extreme bullish positioning can lead to sharp corrections if the sentiment becomes too one-sided. Traders should monitor changes in netflows closely, especially if inflows begin to spike around major resistance levels, as that could mark local tops and signal profit-taking.