Bitcoin Nears $97K Resistance—But Traders Spot Trouble Brewing

Bitcoin’s bull run faces its first real test as it flirts with the $97,000 threshold. Market veterans are flashing warning signs—liquidity drying up, derivatives overheating, and that telltale ’this time it’s different’ energy from Wall Street suits.
Key levels to watch: A clean break above $97K could trigger FOMO-fueled momentum, while rejection here might confirm a local top. Either way, buckle up—volatility’s back on the menu.
Fun fact: The last time BTC saw these levels, traditional finance was still arguing about ’tulips.’ Some things never change.
Technical Analysis
The Daily Chart
Bitcoin has continued its impulsive surge after breaking above the crucial $90K threshold, reaching the $97K resistance region. However, the bullish trend has temporarily stalled at this critical level, with the price struggling to break above it. The recent consolidation NEAR $97K reflects the presence of supply and a clear battle between buyers and sellers.
Additionally, the 100-day moving average has crossed below the 200-day moving average, forming a death cross, which could signal weakening momentum. Given the current structure, Bitcoin appears poised for a short-term corrective pullback or consolidation toward the $90K area before any potential breakout above the $97K resistance.
The 4-Hour Chart
On the lower timeframe, Bitcoin’s struggle at the $97K mark is even more pronounced. After reaching this resistance, the price gradually lost bullish momentum, entering a consolidation phase between $93K and $97K.
A noticeable bearish divergence between the price and the RSI indicator suggests that sellers are gaining strength. This further supports the likelihood of a short-term correction. As it stands, a consolidation or minor retracement within the $93K–$97K range is the most probable scenario before the market gains enough momentum to breach this resistance.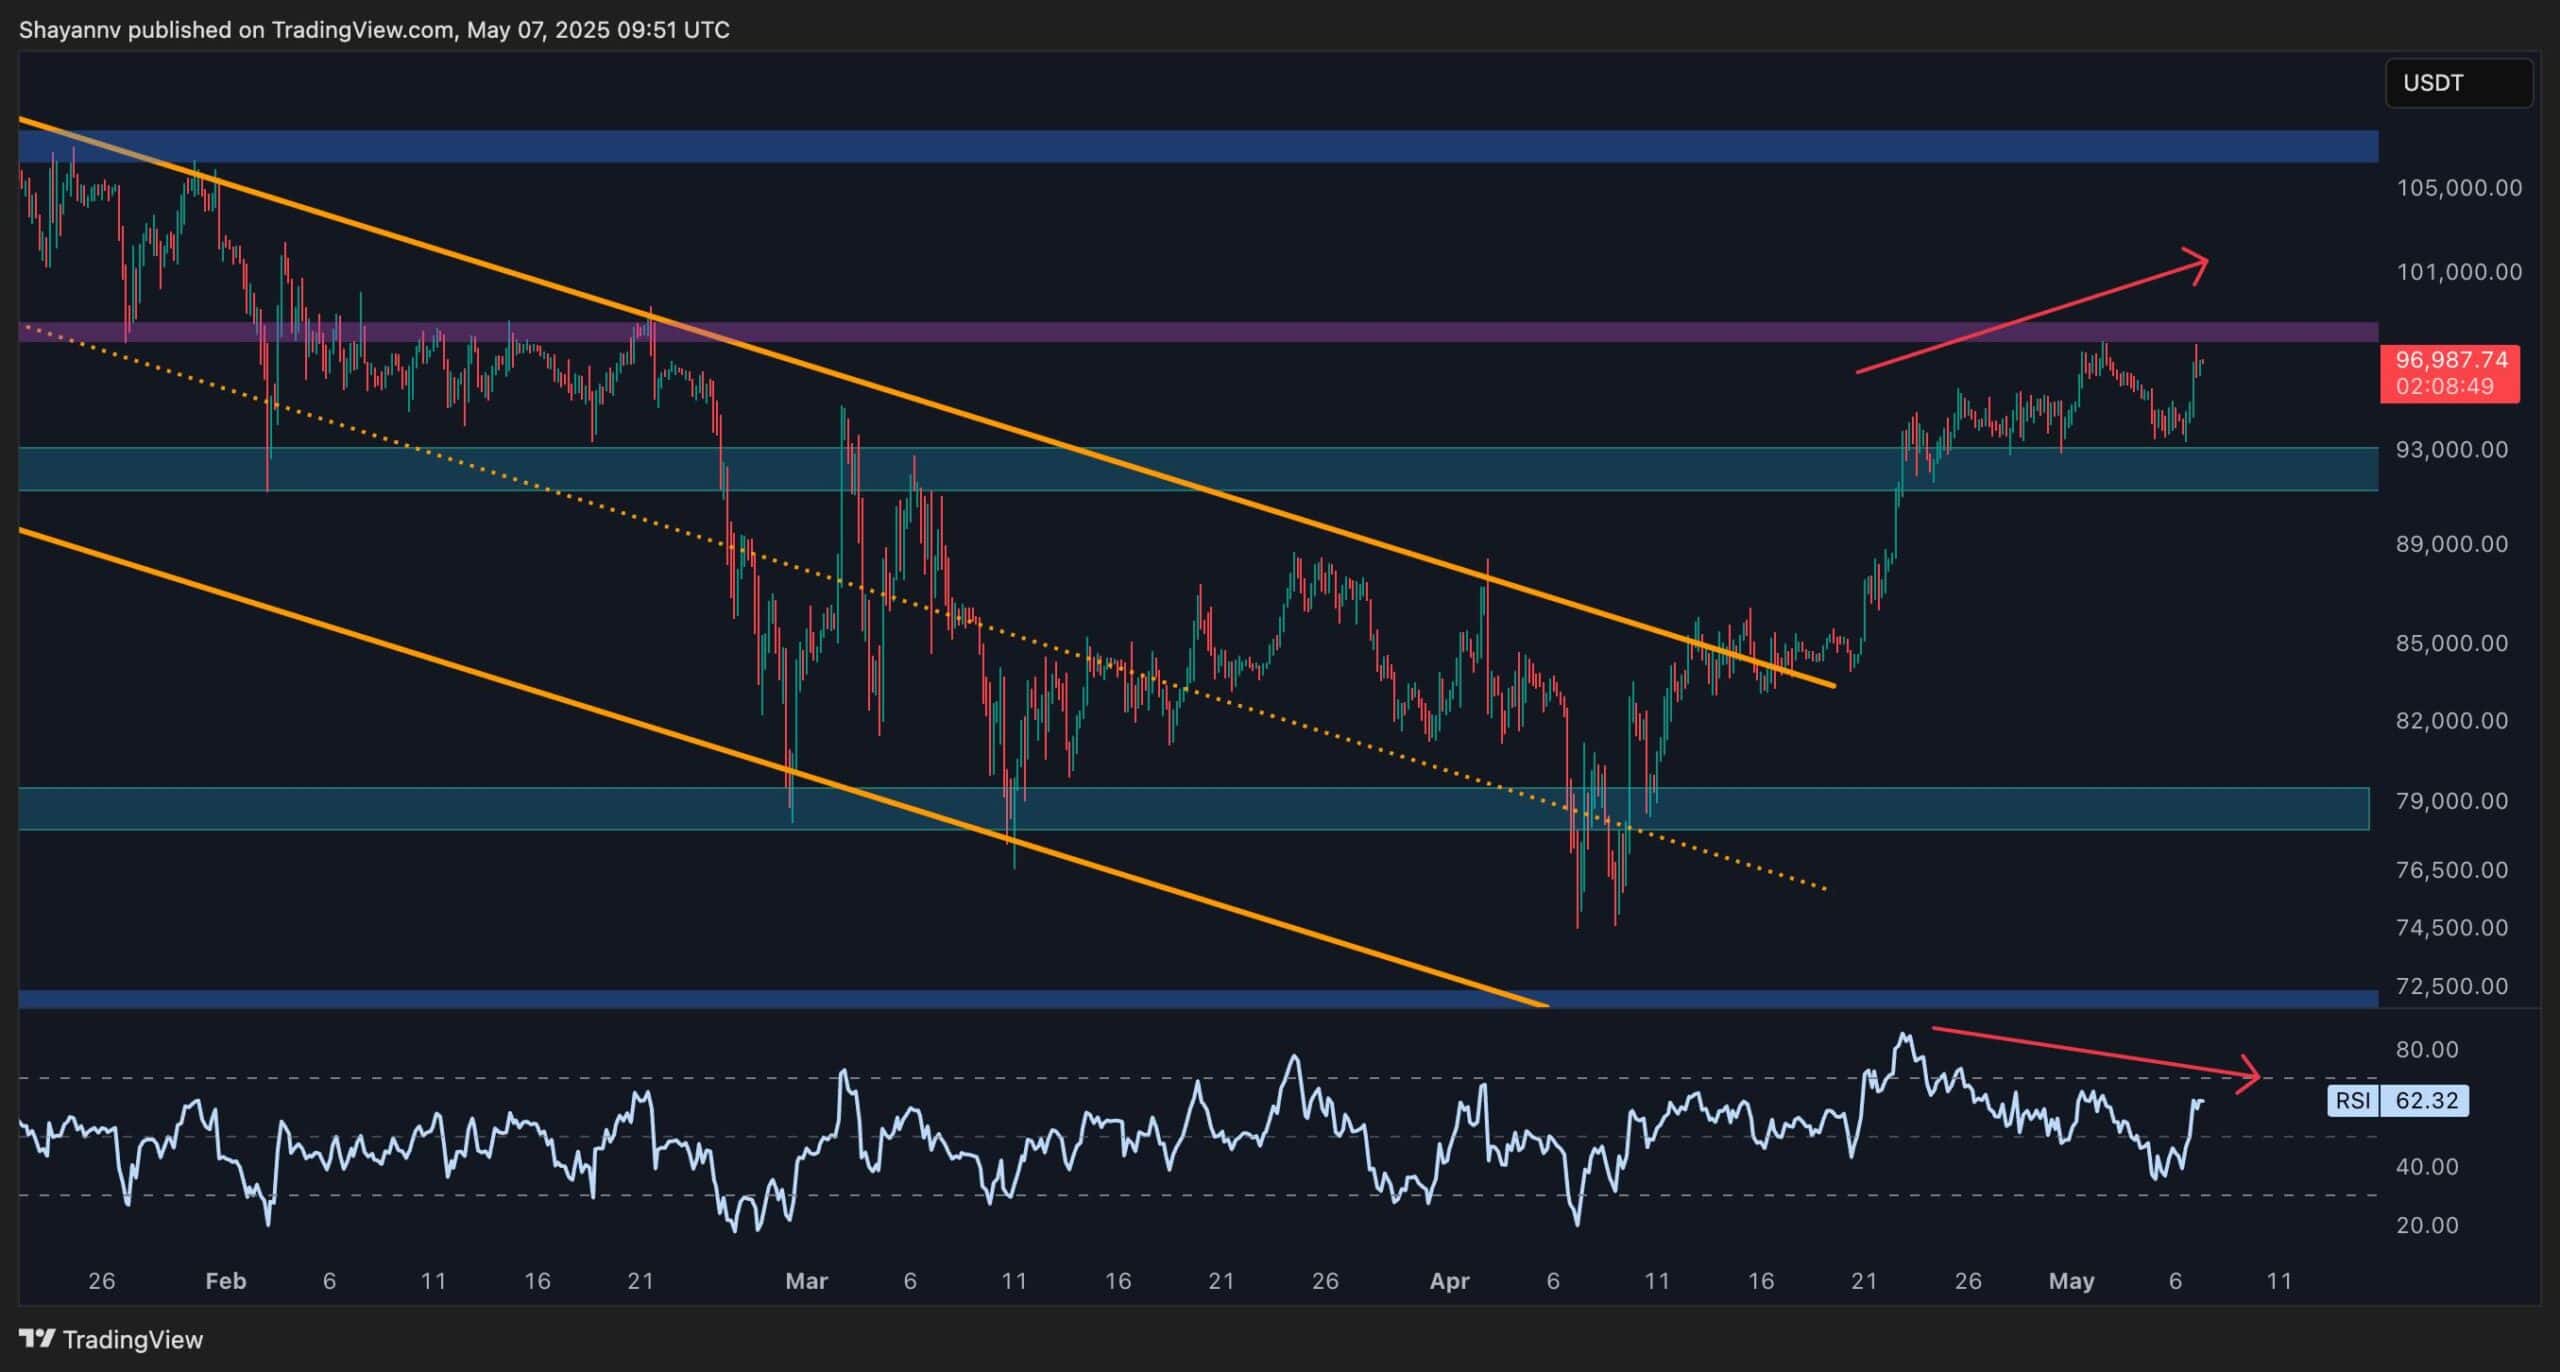
On-chain Analysis
By ShayanMarkets
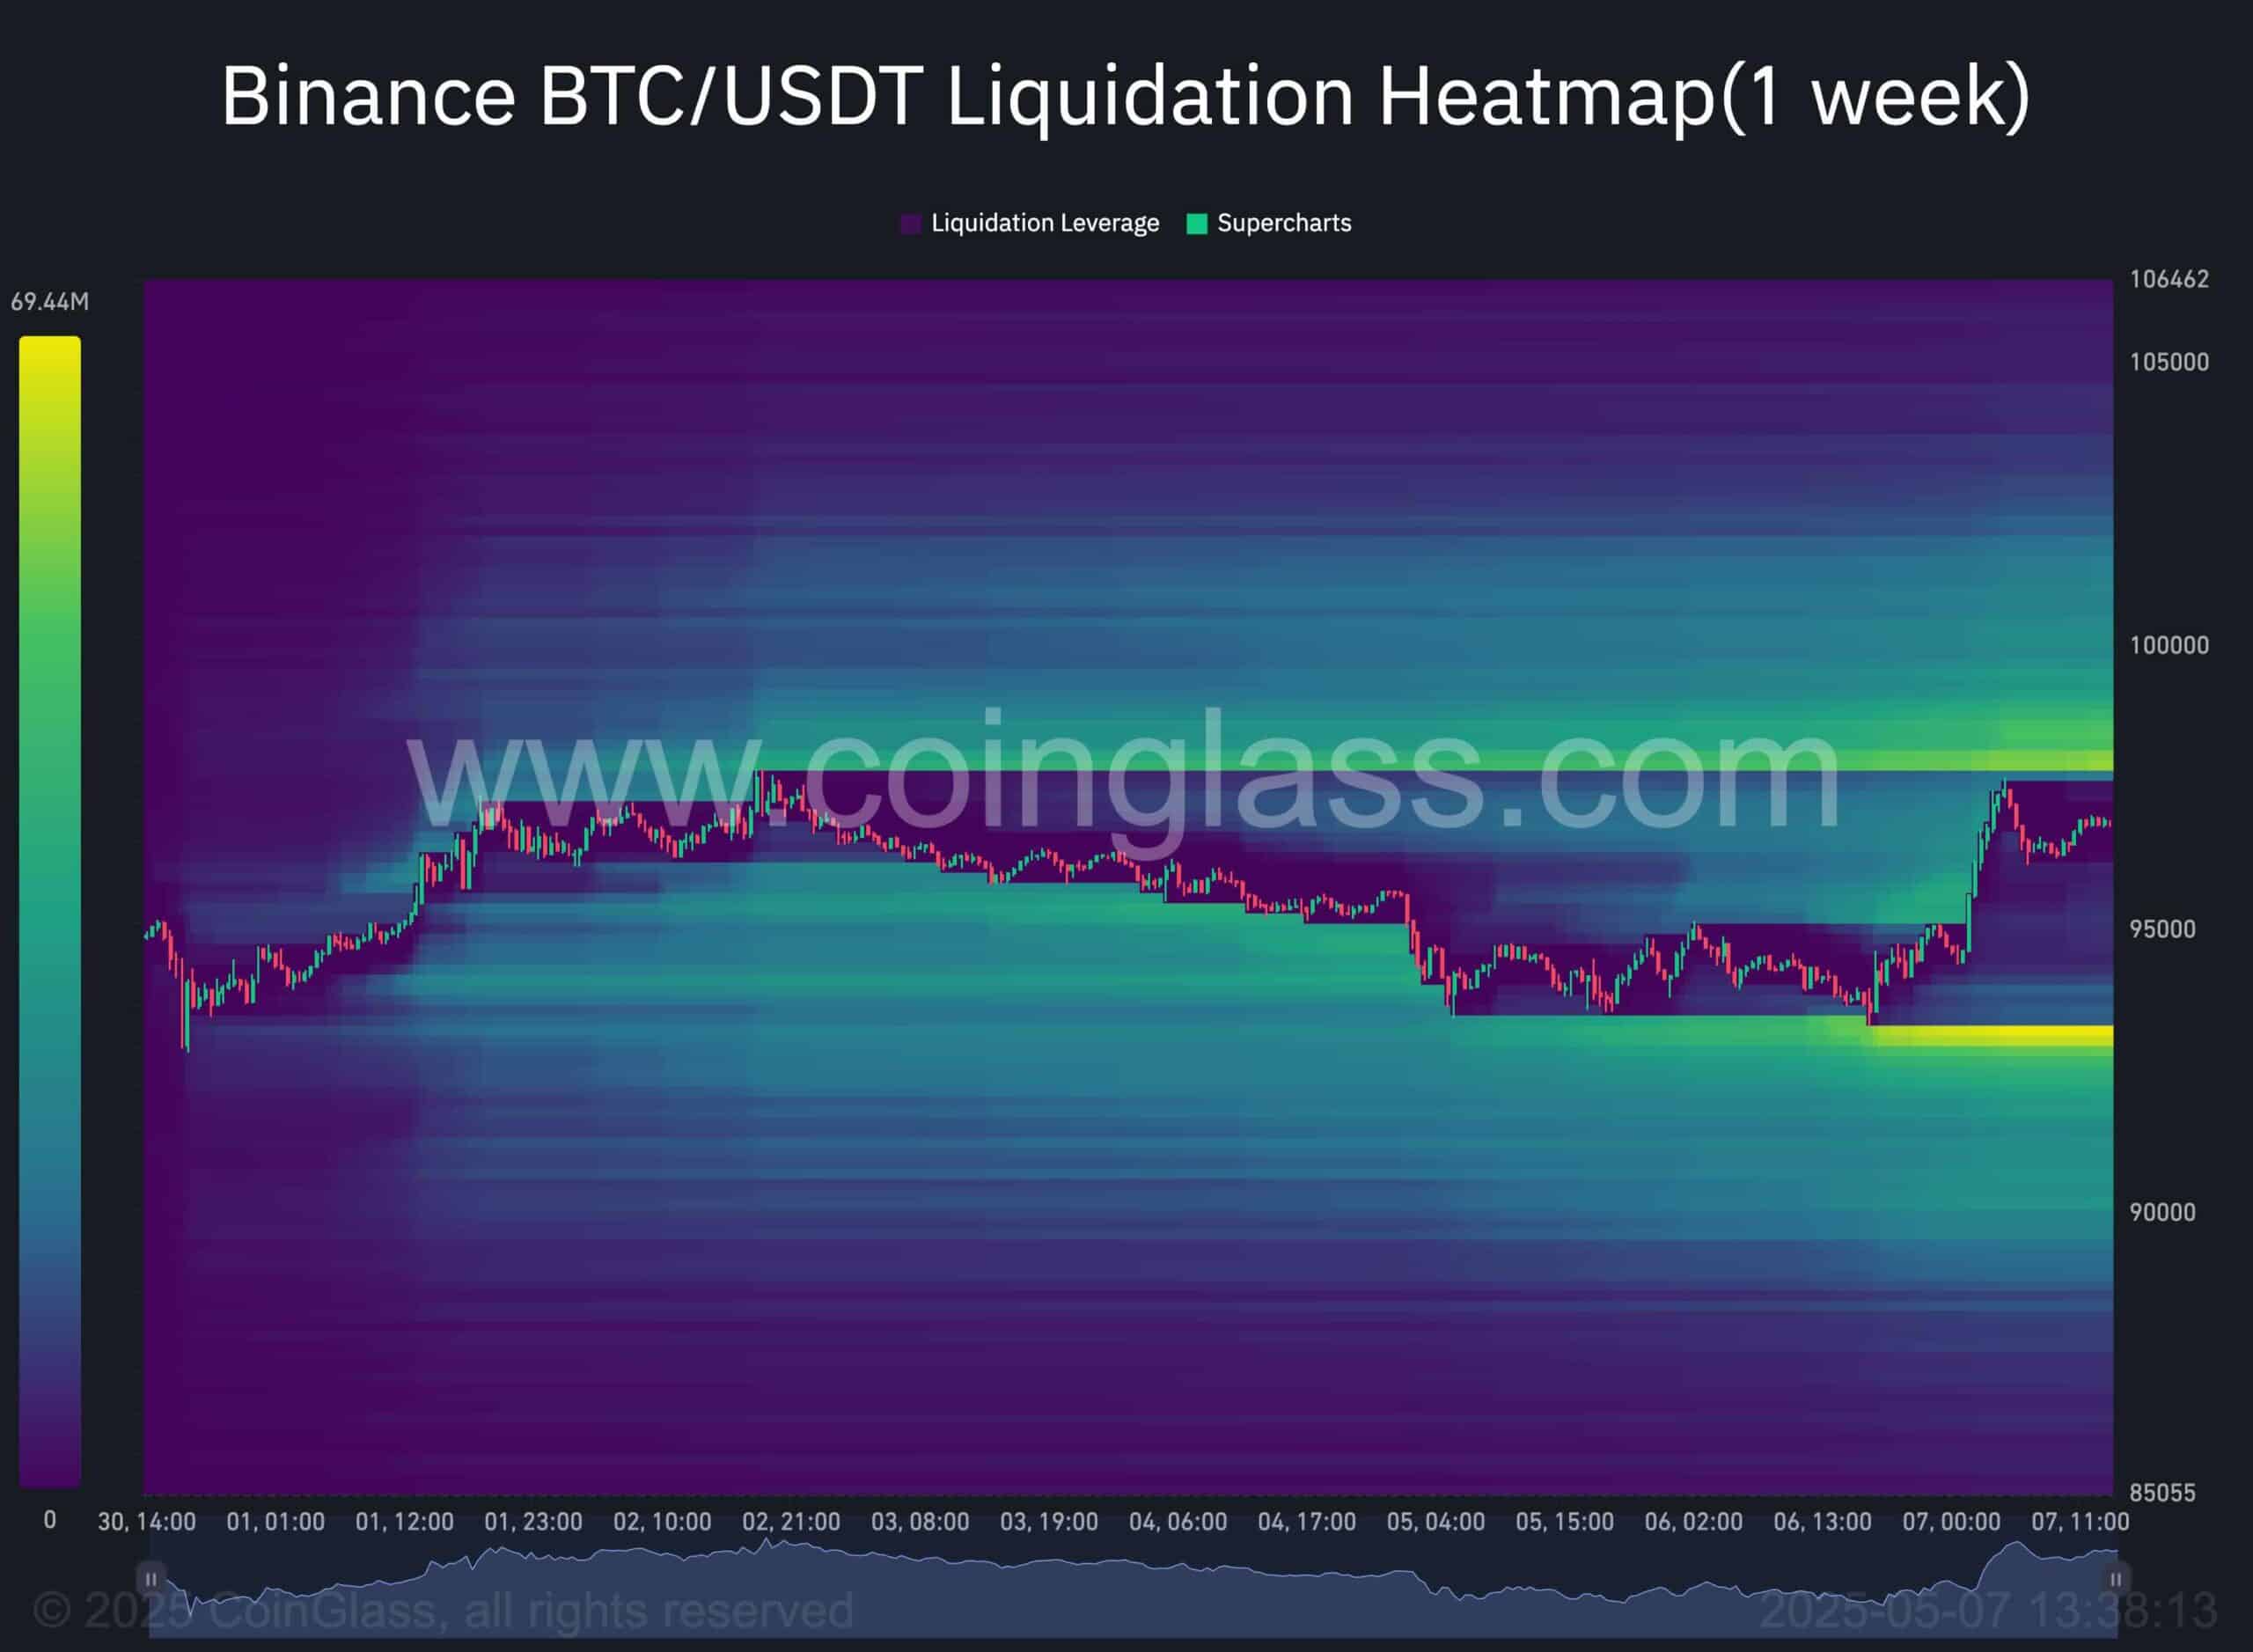
While Bitcoin consolidates at a key level, analyzing futures market metrics offers valuable insight. The chart displays the BTC/USDT Binance liquidation heatmap, highlighting major liquidity pools that could attract price movement.
As shown, two significant liquidity zones exist—one above the $97K level and another below $93K, both near the current price. These areas are likely targets for smart money to trigger liquidations of retail traders. A breakout beyond either threshold could lead to a liquidation cascade and amplify the subsequent move.
Given the market’s overall bullish bias, a temporary dip below $93K remains possible before Bitcoin attempts a breakout above the $97K resistance.