Bitcoin Nears Final Resistance Wall Before Smashing ATH—Traders Hold Breath

Bitcoin’s price action is coiled like a spring—one last technical hurdle stands between current levels and uncharted territory. The $75k resistance level has become the make-or-break zone for bulls, with on-chain data showing massive liquidity stacking up just beyond.
Why this level matters: A clean breakout here would trigger algorithmic buy orders from institutional traders (and yes, those late-to-the-game hedge funds who still think ’blockchain’ is a type of yoga).
Watch the volume: Thin weekend trading could either fuel a violent breakout or trap overleveraged longs—because nothing screams ’healthy market’ like 100x leverage on a volatile asset class.
Technical Analysis
By ShayanMarkets
The Daily Chart
BTC’s recent breakout above the decisive $95K resistance marks a key technical and psychological victory for the bulls. Following a brief consolidation period around this level, renewed buying pressure drove the price firmly higher, signaling the continuation of the bullish trend that began after the correction phase earlier this year.
This breakout is a notable bullish development, as the $95K level had previously capped Bitcoin’s advances and aligned with prior swing highs. However, the focus now shifts to the $100K resistance zone, a round number that historically carries significant psychological weight. It is likely to be filled with latent sell orders, take-profit triggers, and institutional distribution, all of which could temporarily stall or reverse upward momentum.
If bulls manage to breach this psychological barrier decisively, it would likely result in a strong continuation rally, with the next logical target being Bitcoin’s all-time high at $109K.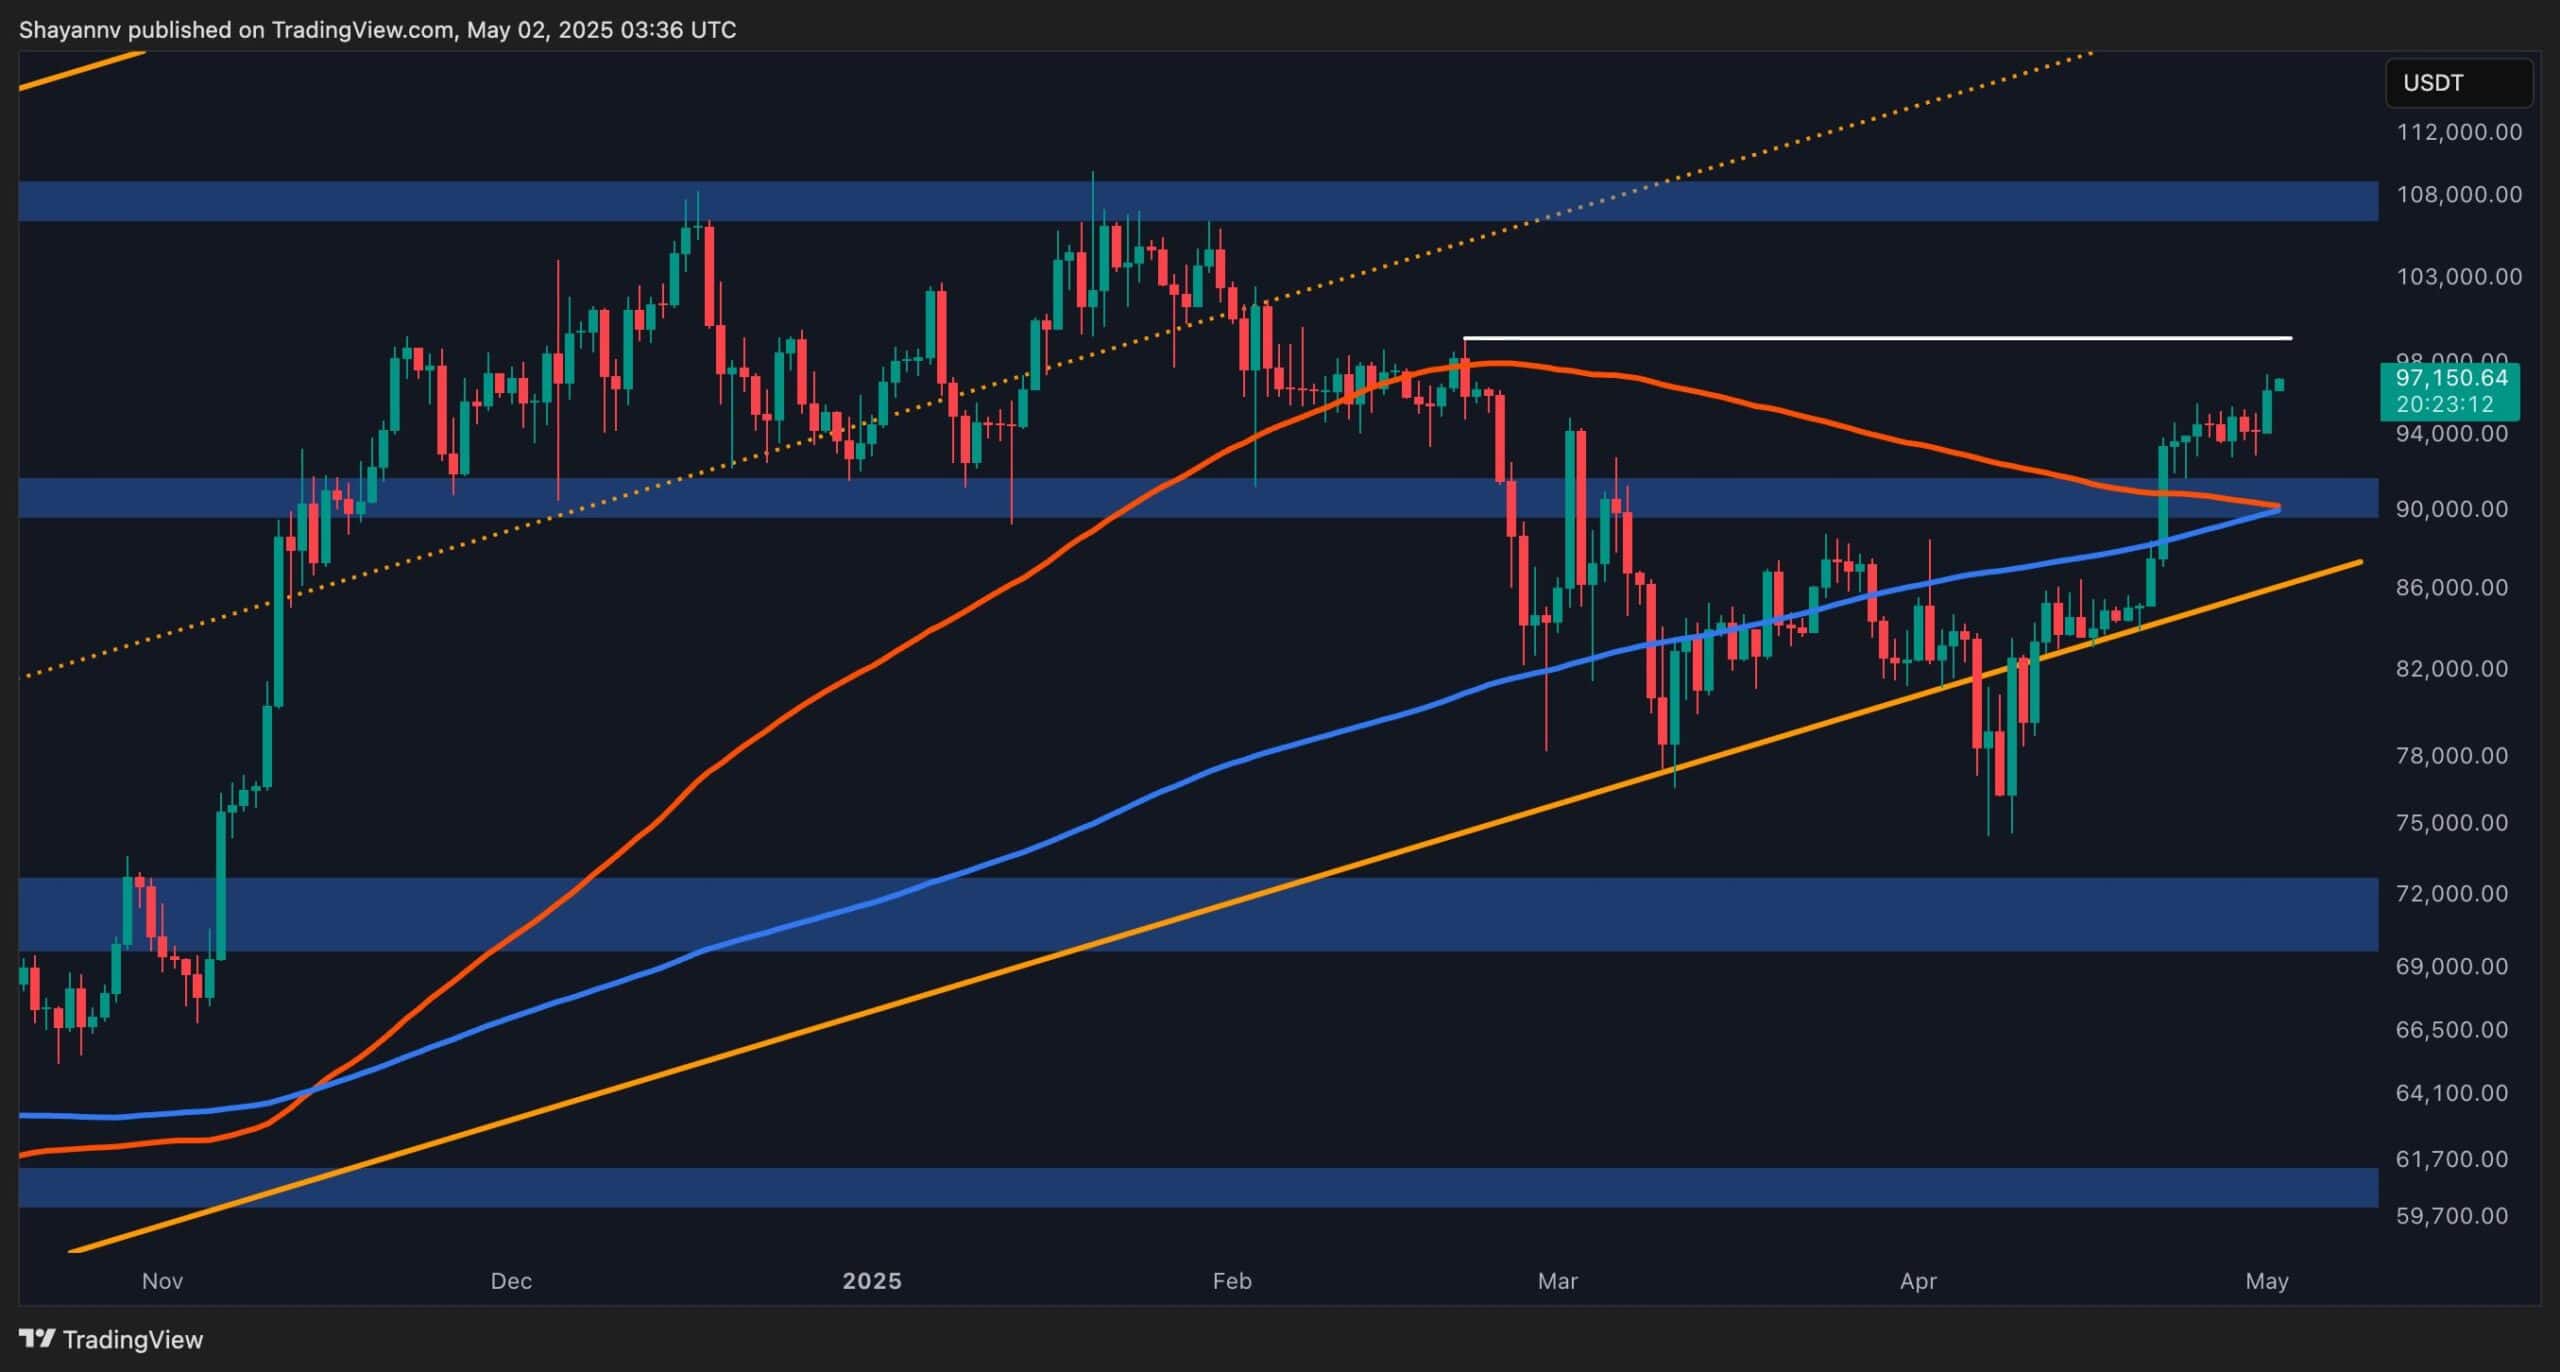
The 4-Hour Chart
On the 4-hour timeframe, Bitcoin initially paused at the $95K resistance, forming a sideways consolidation structure indicative of supply absorption. However, this consolidation was short-lived, as new demand flooded the market, resulting in a clean breakout above $95K, confirming buyers’ dominance and the validity of the prior breakout.
Despite the strength of this move, the $100K mark now stands as the next major challenge. This level not only aligns with psychological resistance but also coincides with a prior major swing high, increasing its technical relevance.
Should BTC fail to overcome $100K on its first attempt, profit-taking and smart money distribution could trigger a rejection and a corrective pullback toward the $90K support zone, where the 100 and 200-day moving averages currently provide structural reinforcement.
Alternatively, the more probable short-term scenario is a consolidation phase below $100K, allowing the market to accumulate momentum before a potential breakout toward the $109K ATH.
On-chain Analysis
By Shayan
The Taker Buy/Sell Ratio is a key on-chain metric that measures the ratio of market buy orders to market sell orders on exchanges such as Binance.
In the latest reading, the Taker Buy/Sell Ratio has spiked sharply, reaching the highest level observed within the recent months. This surge suggests that market participants are increasingly executing market buy orders, reflecting a shift from passive accumulation to aggressive entry at market prices.
Such behaviour typically occurs when investors and traders are confident in an imminent price increase or fear missing out on a rally, classic signs of strong bullish sentiment. The spike on the ratio chart highlights an influx of taker buy volume, confirming that buyers are actively chasing price, rather than waiting for lower entries. This behavioural shift often precedes strong upward momentum in price action, especially when coupled with rising open interest and positive price structure.
