Ethereum’s Next Act: Bullish Predictions Defy Market Skeptics

ETH surges past $5,000—again—as analysts scramble to revise targets. Here’s why the smart money’s betting on blue-chip crypto.
### The Case for $10K ETH
Institutional adoption, ETF approvals, and that sweet, sweet deflationary burn rate have whales accumulating. Even the SEC’s foot-dragging can’t kill this rally.
### The Bear Trap Argument
Sure, gas fees still spike like a 2017 ICO frenzy, and Layer 2 solutions feel like duct tape on the Titanic. But try telling that to the stakers earning 5% while TradFi bonds yield pocket lint.
### The Bottom Line
Wall Street’s still calling it ’speculative’—right before quietly allocating 2% of their portfolio. Classic hedge fund hypocrisy meets Web3 inevitability.

What Does the Future Hold?
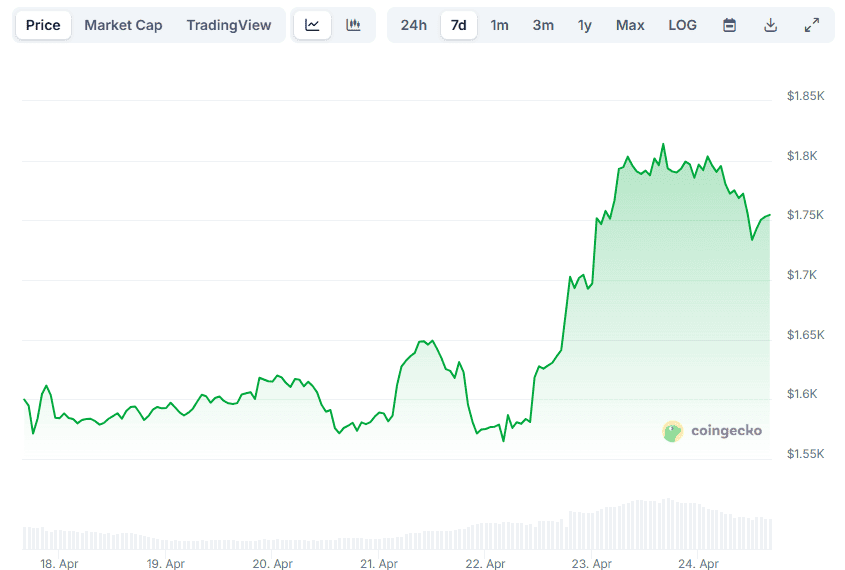
Ethereum (ETH) has witnessed evident progress in the past week, with its price rising by roughly 10%. It briefly surpassed $1,800 on April 23 before retracing to the current $1,750.
Some market observers think the asset has yet to unleash its full potential, envisioning high targets for the near future. The X user Ted noted Ethereum’s active addresses have increased by 10% in the span of 48 hours. Having that said, he assumed that ETH could be gearing up for an “epic revenge rally.”
The crypto trader, using the X moniker Christiaan, also weighed in. He explored the recent price fluctuations of the asset to suggest that the price may soon soar beyond $2,000.
Gert van Lagen is among the biggest optimists. The technical analyst claimed that “a huge 4-year inverse head and should” is in play, meaning that the next move could be a gigantic surge to a new peak of approximately $20,000.
“Loads of retail have been shaken out the Right Shoulder,” he added.
Exploring Some Indicators
Contrary to the bullish predictions mentioned above, certain metrics signal that the second-largest cryptocurrency might be poised for a pullback.
ETH’s exchange netflow, for instance, has been positive in the past month. This reflects a shift toward centralized trading platforms, which can result in increased selling activity in the short term.
We’re moving on to the recent net inflows into spot ETH ETFs. Data compiled by SoSoValue shows that the figure has rarely been above zero in the last couple of weeks. A substantial green candle was observed on April 22, but on many other occasions, the inflows were negative. In simpler words, this means more money was withdrawn from the ETFs than added, signaling uncertainty among institutional investors.
Lastly, let’s examine ETH’s Relative Strength Index (RSI). The metric measures the speed and magnitude of the latest price changes and helps traders assess point reversals. A ratio above 70 is considered bearish, suggesting ETH has entered overbought territory and could be headed for a correction. Earlier today (April 24), the RSI was hovering above that zone, currently set at around 65.
