Bitcoin Price Alert: BTC Faces Major Correction Threat as Key Metric Weakens

Bitcoin's foundation shows cracks—and traders are watching one critical indicator that could signal the next big move down.
The Metric That Matters
While Bitcoin maintains its position as digital gold, technical signals suggest the throne might be wobbling. One specific metric—the kind Wall Street analysts would normally dismiss until it's too late—is flashing warning signs that even crypto optimists can't ignore.
Market Mechanics Under Pressure
Trading volumes, network activity, and institutional flows all contribute to Bitcoin's health assessment. When key support levels start looking like Swiss cheese, even the most bullish scenarios need recalibration. Remember when traditional finance called crypto a bubble? They might actually be right this time—about the correction, not the technology.
Risk Management in Volatile Waters
Smart money isn't panicking—it's repositioning. The same volatility that creates millionaires overnight can wipe them out by morning. Diversification and stop-losses aren't just conservative strategies anymore; they're survival tactics in a market that eats the unprepared for breakfast.
Bottom Line: Bitcoin's resilience gets another stress test. Whether it becomes a buying opportunity or the start of something uglier depends entirely on whether this key metric recovers—or continues its concerning slide.
Technical Analysis
By Shayan
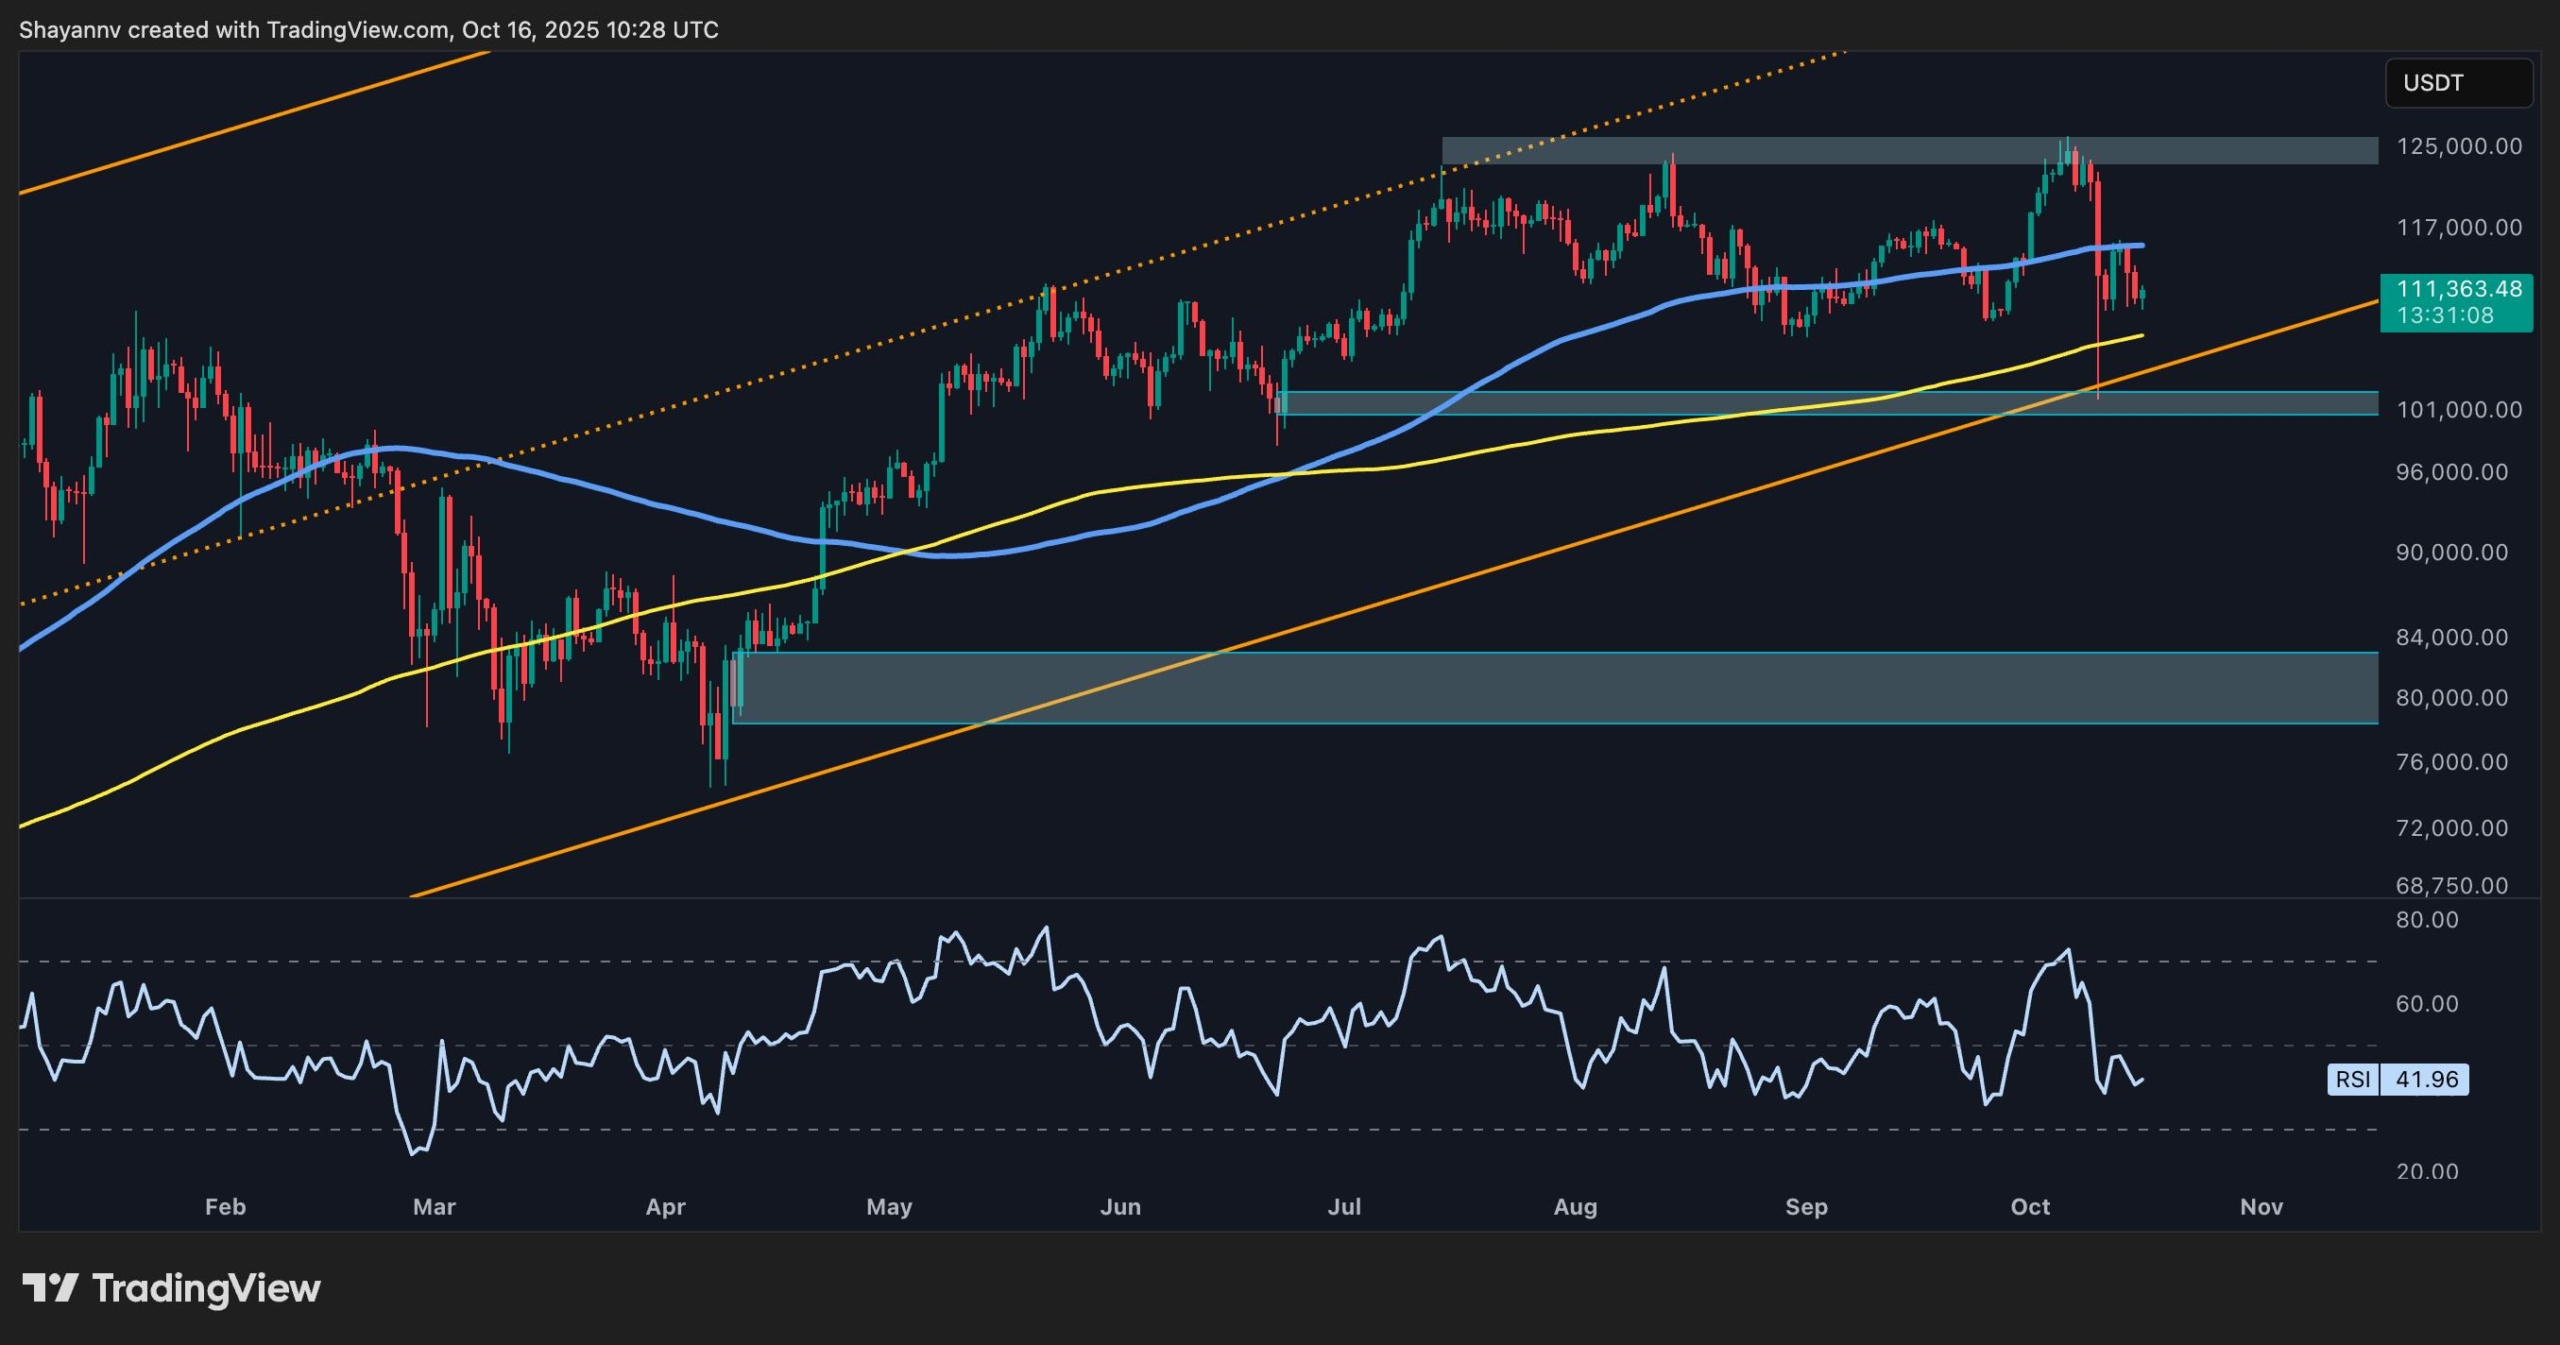
The Daily Chart
On the daily chart, BTC is hovering just above key support around $110,000, which is the critical 200-day moving average, while the 200-day moving average is acting as a resistance above the price around $116,000.
The $110,000 area remains critical, and a decisive breakdown could send the market toward $101,000 and the lower boundary of the large descending channel. Meanwhile, the RSI around 42 signals neutral momentum, reflecting hesitation among both bulls and bears. Unless Bitcoin reclaims $116,000 with strong volume, the broader uptrend remains at risk of losing its mid-term structure.
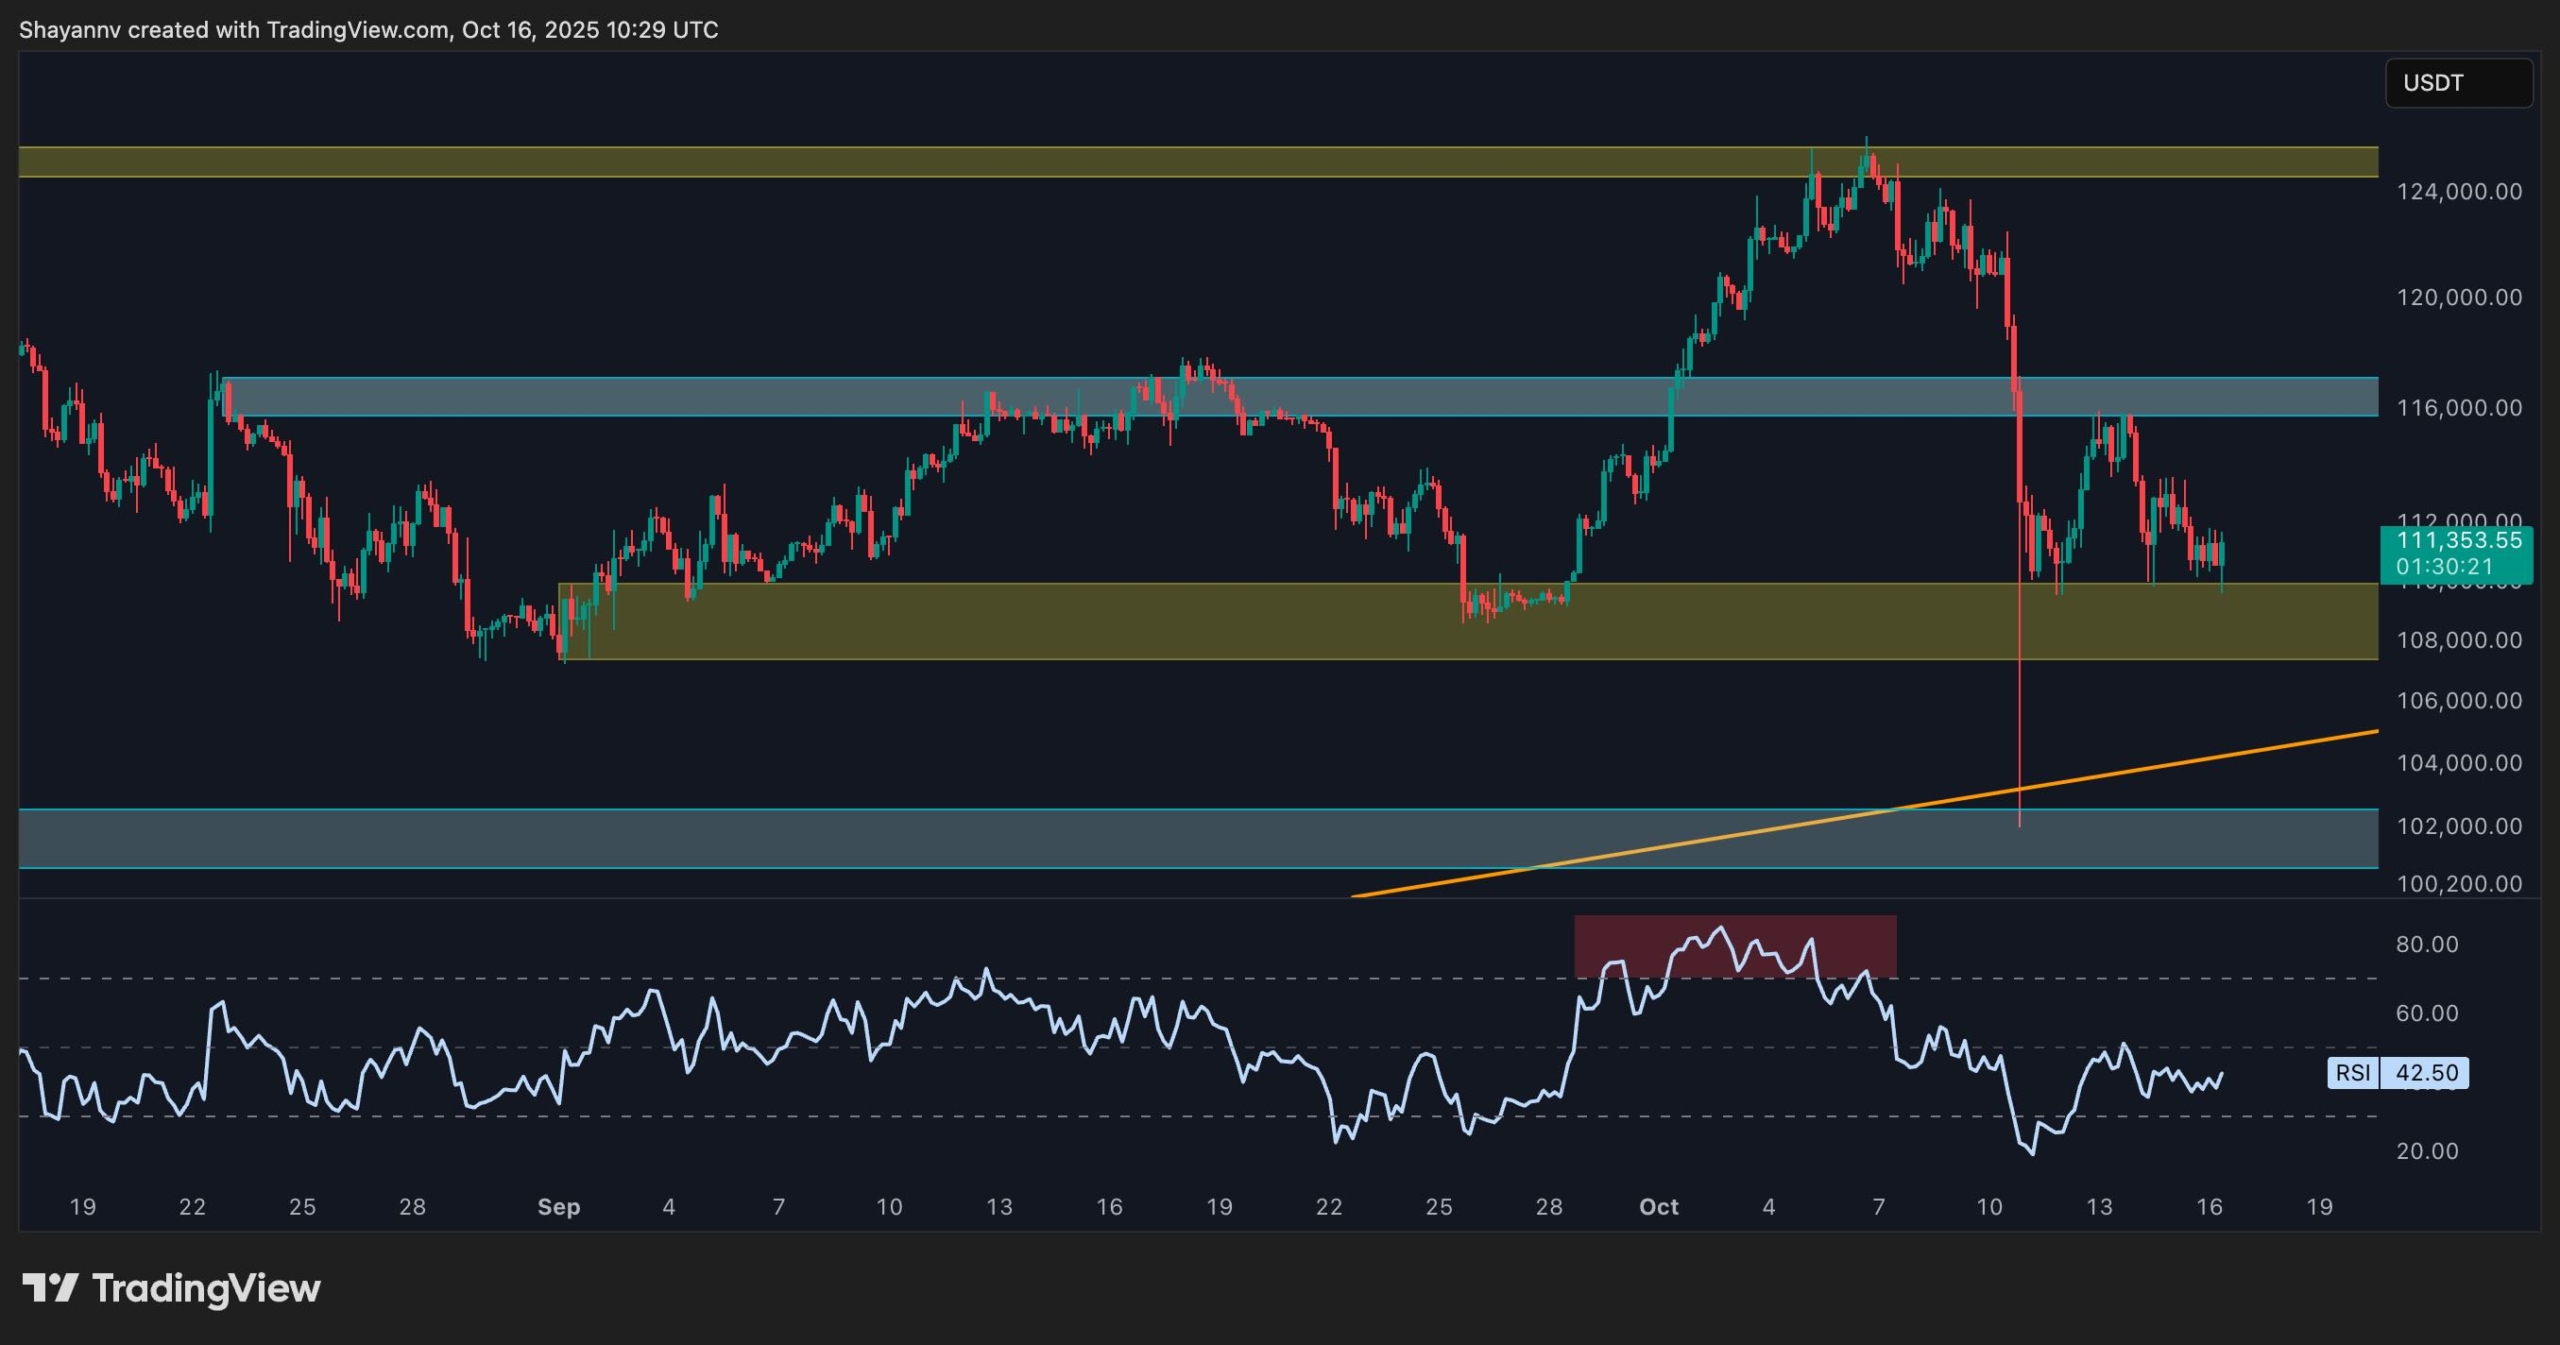
The 4-Hour Chart
The 4-hour chart highlights a tight consolidation between $110,000 and $116,000 after the strong downward impulse. The $110,000 range continues to hold as a demand zone, but repeated tests have weakened its reliability.
Resistance sits at $116,000, as already mentioned, which capped every recovery attempt over the past few days. The RSI also remains flat NEAR 40, indicating equilibrium on the 4-hour timeframe, but the lack of momentum suggests the market could break down if sellers regain control.
Sentiment Analysis
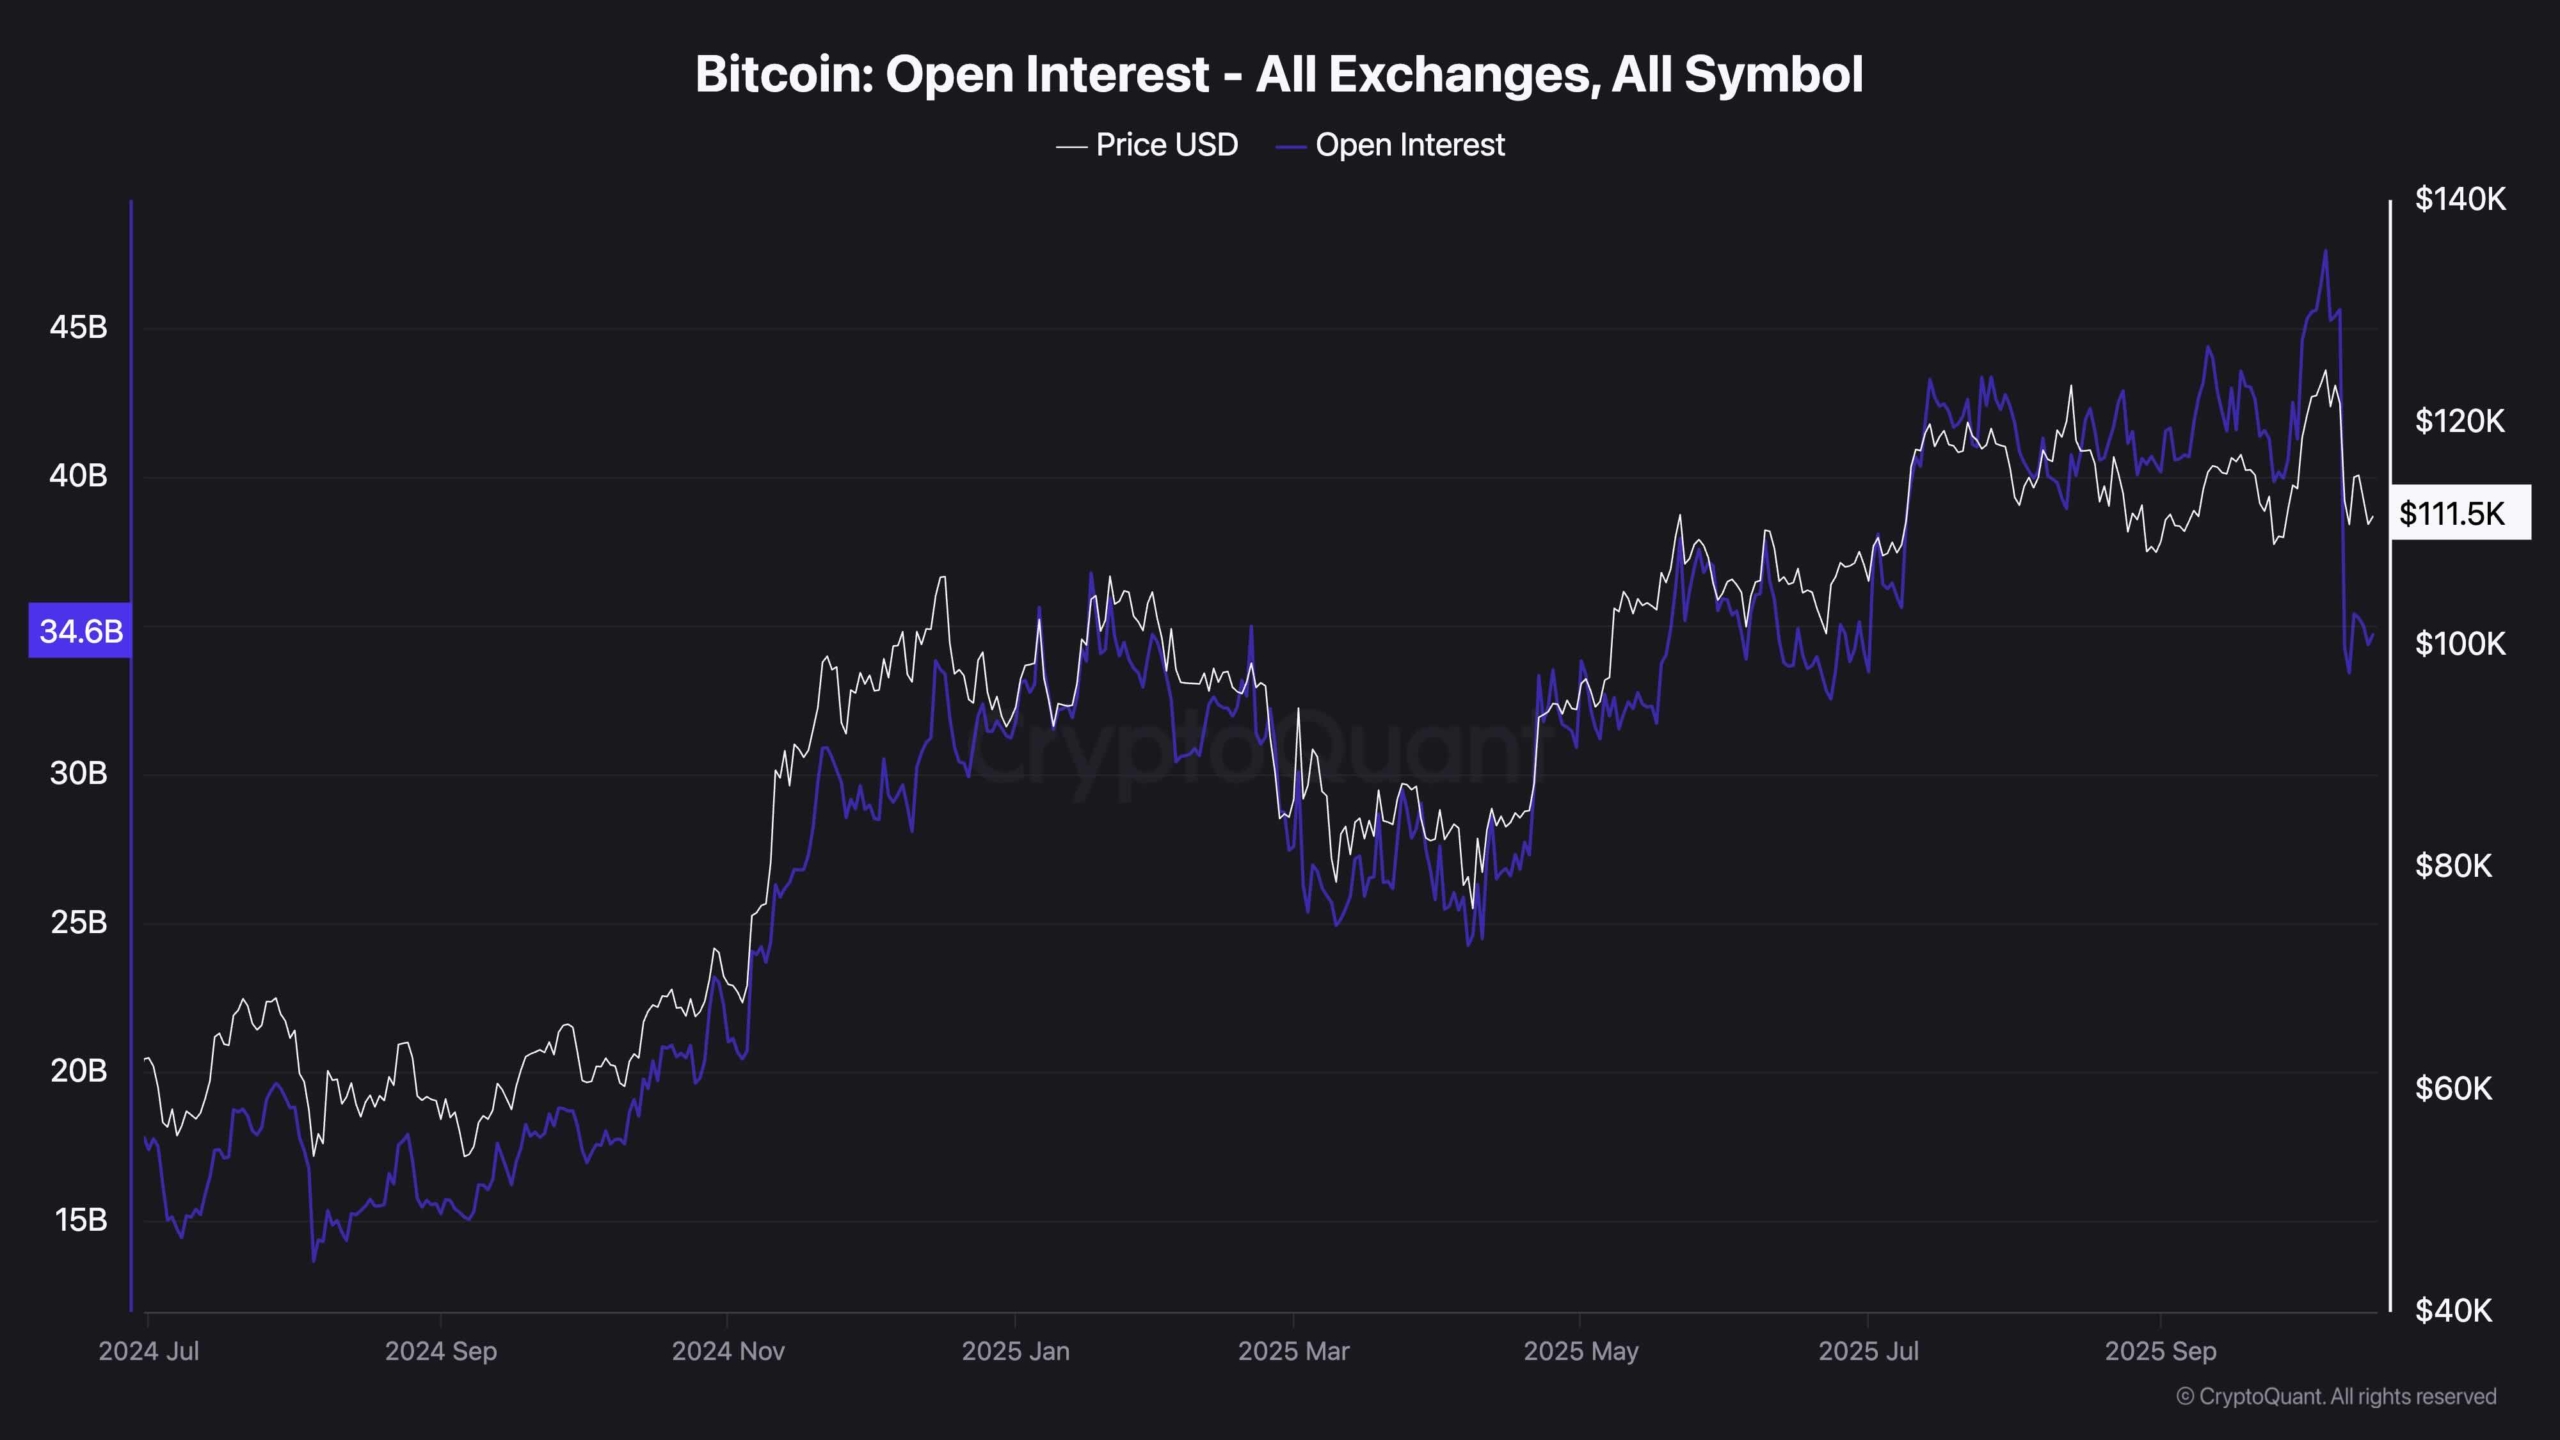
Futures Open Interest
Open interest across exchanges has sharply declined following the recent selloff, reflecting a clear reduction in speculative activity. Traders are avoiding aggressive positions after getting liquidated during the last MOVE down.
This decline in leverage shows that the market is resetting, but it also signals a lack of conviction for any strong bullish continuation in the short term. Investor sentiment remains fragile, as fear is outweighing greed, and most participants are waiting for a stronger confirmation before re-entering long positions.