XRP Defense Lines: Critical Support Levels That Could Save Ripple From Total Collapse

Ripple's fortress walls are being tested—again.
The Battle for $0.42
XRP bulls have drawn their line in the sand at the $0.42 support level. Break this, and the floodgates open to lower defenses.
Secondary Defenses at $0.38
If the first wall falls, the $0.38 zone becomes the last stand before potentially catastrophic losses. Market makers are watching this like hawks—or vultures, depending on your perspective.
The $0.35 Nuclear Option
Should both support levels crumble, the $0.35 region becomes the final hope. A breakdown here would confirm what the bears have been screaming all along.
Traders are positioning for either a heroic bounce or another 'learning opportunity'—because in crypto, we don't call them losses anymore.
Technical Analysis
By Shayan
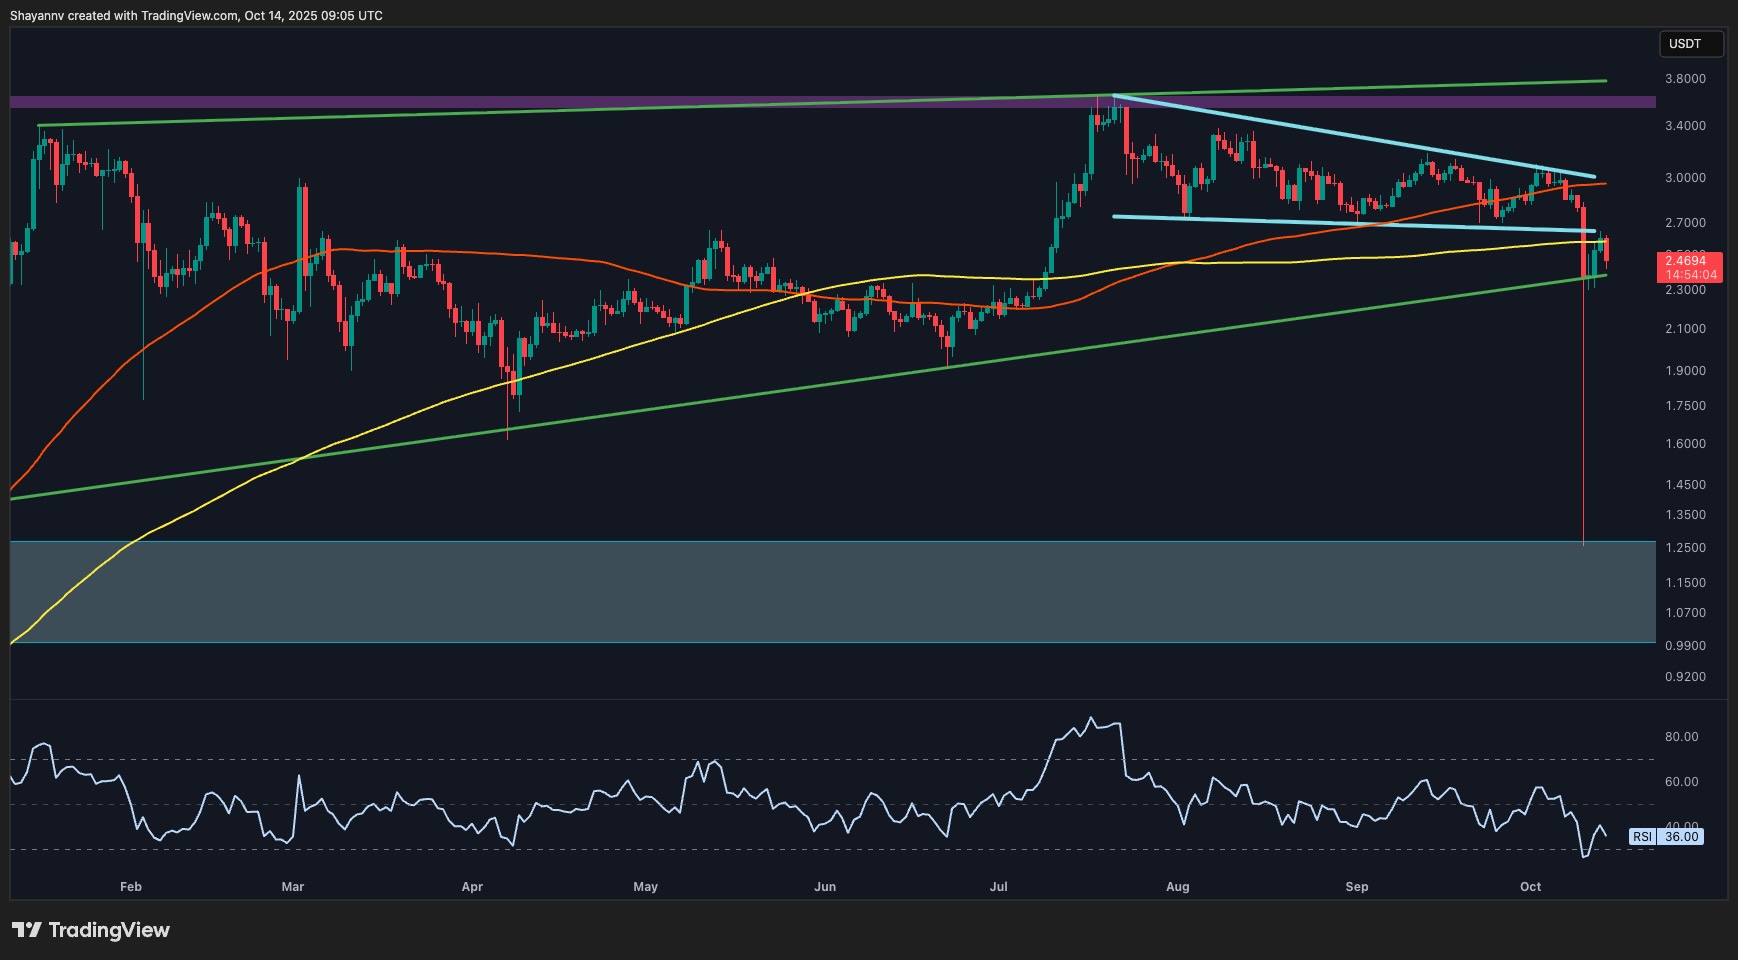
The USDT Pair
On the USDT pair, XRP has broken below the falling wedge pattern that had been forming since August, invalidating the previous bullish setup. The market even dropped to as low as $1.25 (on some exchanges) but recovered above $2.00 on the crash day. The price is now testing the lower boundary of the long-term ascending channel shown in green, while sitting just above a key support zone NEAR $2.00.
The 100-day and 200-day moving averages have turned into resistance levels, with the RSI hovering around 36, signaling lingering bearish pressure. If the current structure fails to hold, XRP could drop toward the $2.00 area and even lower toward $1.25 in the coming weeks, signalling the beginning of a bear market. On the upside, reclaiming the $2.70 zone WOULD be the first sign of renewed strength.
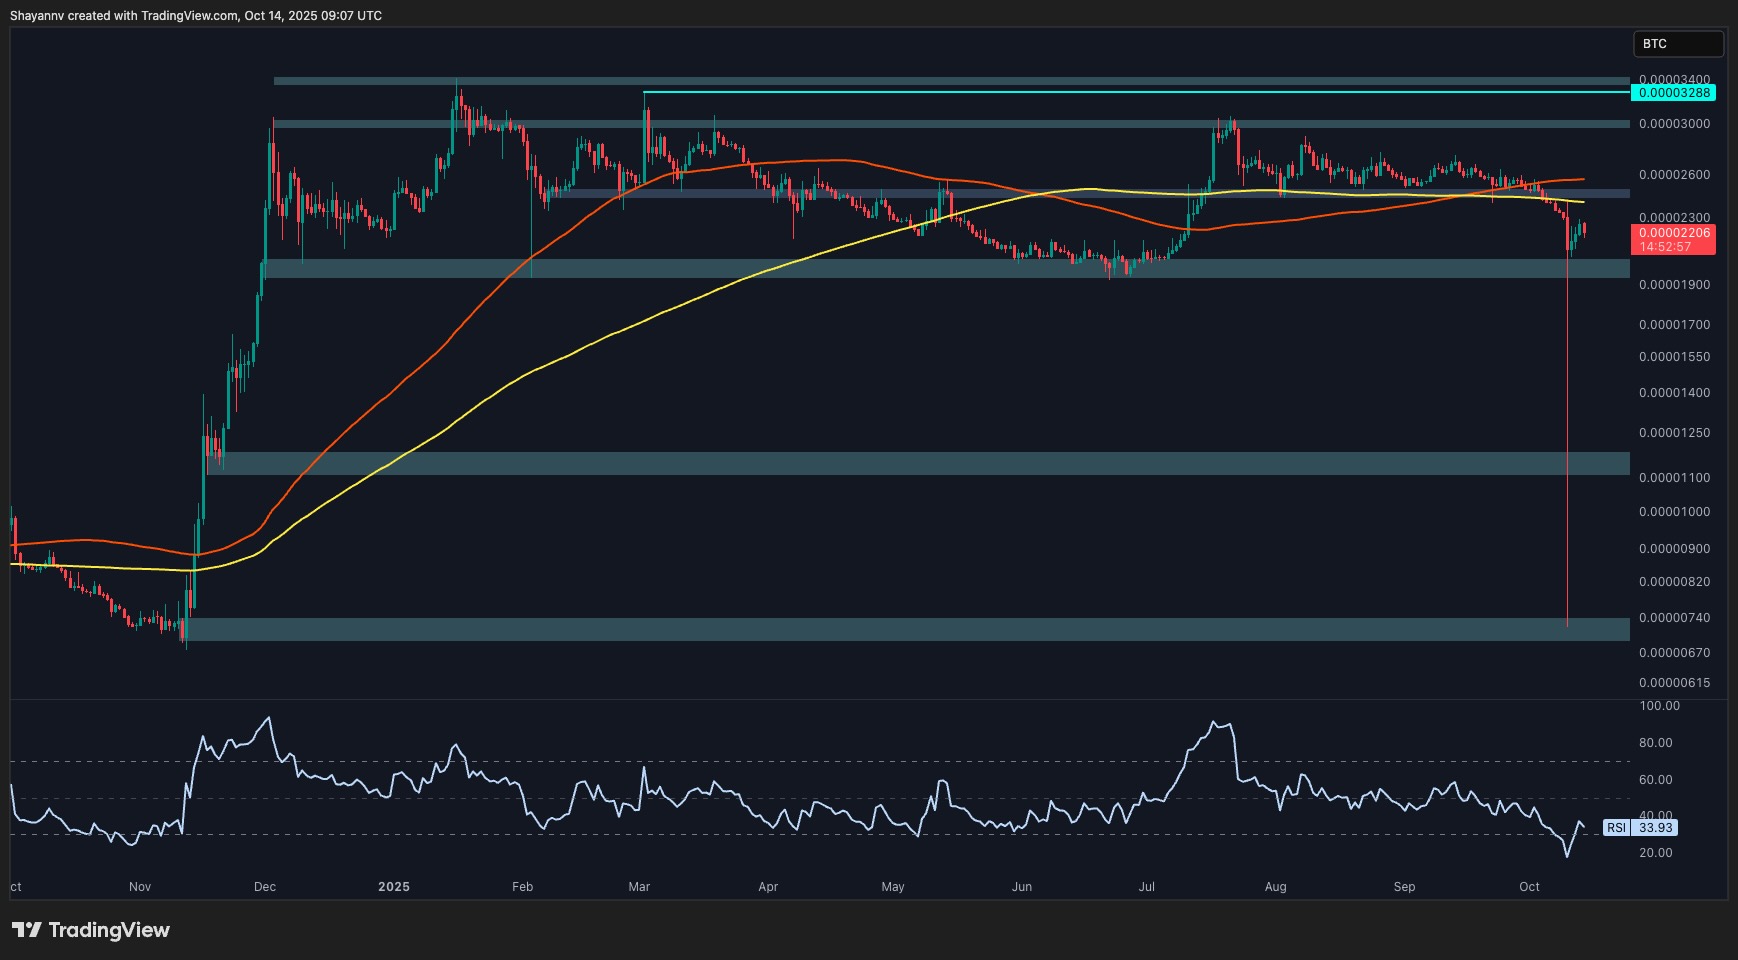
The BTC Pair
The XRP/BTC pair shows the massive magnitude of the flash crash, as the price has dropped from around 2,000 SAT to 700 SAT and rebounded in a day, leaving an enormous wick.
The pair now trades just above the 2,000 SAT support zone, but both the 100-day and 200-day moving averages are sloping down from above, confirming bearish market structure.
Meanwhile, the RSI has slightly recovered from DEEP oversold levels but remains below 40, suggesting limited bullish momentum for now. If the 2,000 SAT level fails to hold, the next strong support sits near the 1,500 SAT order block. On the contrary, a recovery above 2,500 SAT would be needed to confirm any meaningful reversal.