Ethereum’s $4K Cliff Edge: How Far Will ETH Plumble If Critical Support Collapses?

Ethereum teeters on the brink as its $4,000 foundation shows alarming cracks. The second-largest cryptocurrency faces its most critical test since the last bull run.
The Support Breakdown
Traders watch in real-time as Ethereum battles to maintain its psychological price floor. Lose this level, and technical analysts predict a cascade of stop-loss orders triggering a freefall. The $4,000 mark isn't just another number—it's the line between correction and catastrophe.
Market Mechanics at Play
Liquidations stack up on both sides of the trade. Leveraged longs sweat while shorts circle like sharks smelling blood. Exchanges report unusual options activity as institutional players hedge against a potential breakdown. The entire altcoin market holds its breath—when Ethereum sneezes, the rest catch cold.
Historical Precedents
Previous support breaks have seen Ethereum retrace 30-50% within weeks. If history rhymes, we could be looking at a return to $2,800-$3,200 levels. Though let's be honest—crypto has a funny way of making historians look foolish.
Traditional finance analysts would call this 'price discovery'—crypto traders call it 'sweaty palms season'. Either way, the next move could define Ethereum's trajectory for months. Because nothing says 'sound monetary policy' like watching digital assets swing 20% on a celebrity tweet.
Technical Analysis
By Shayan
The Daily Chart
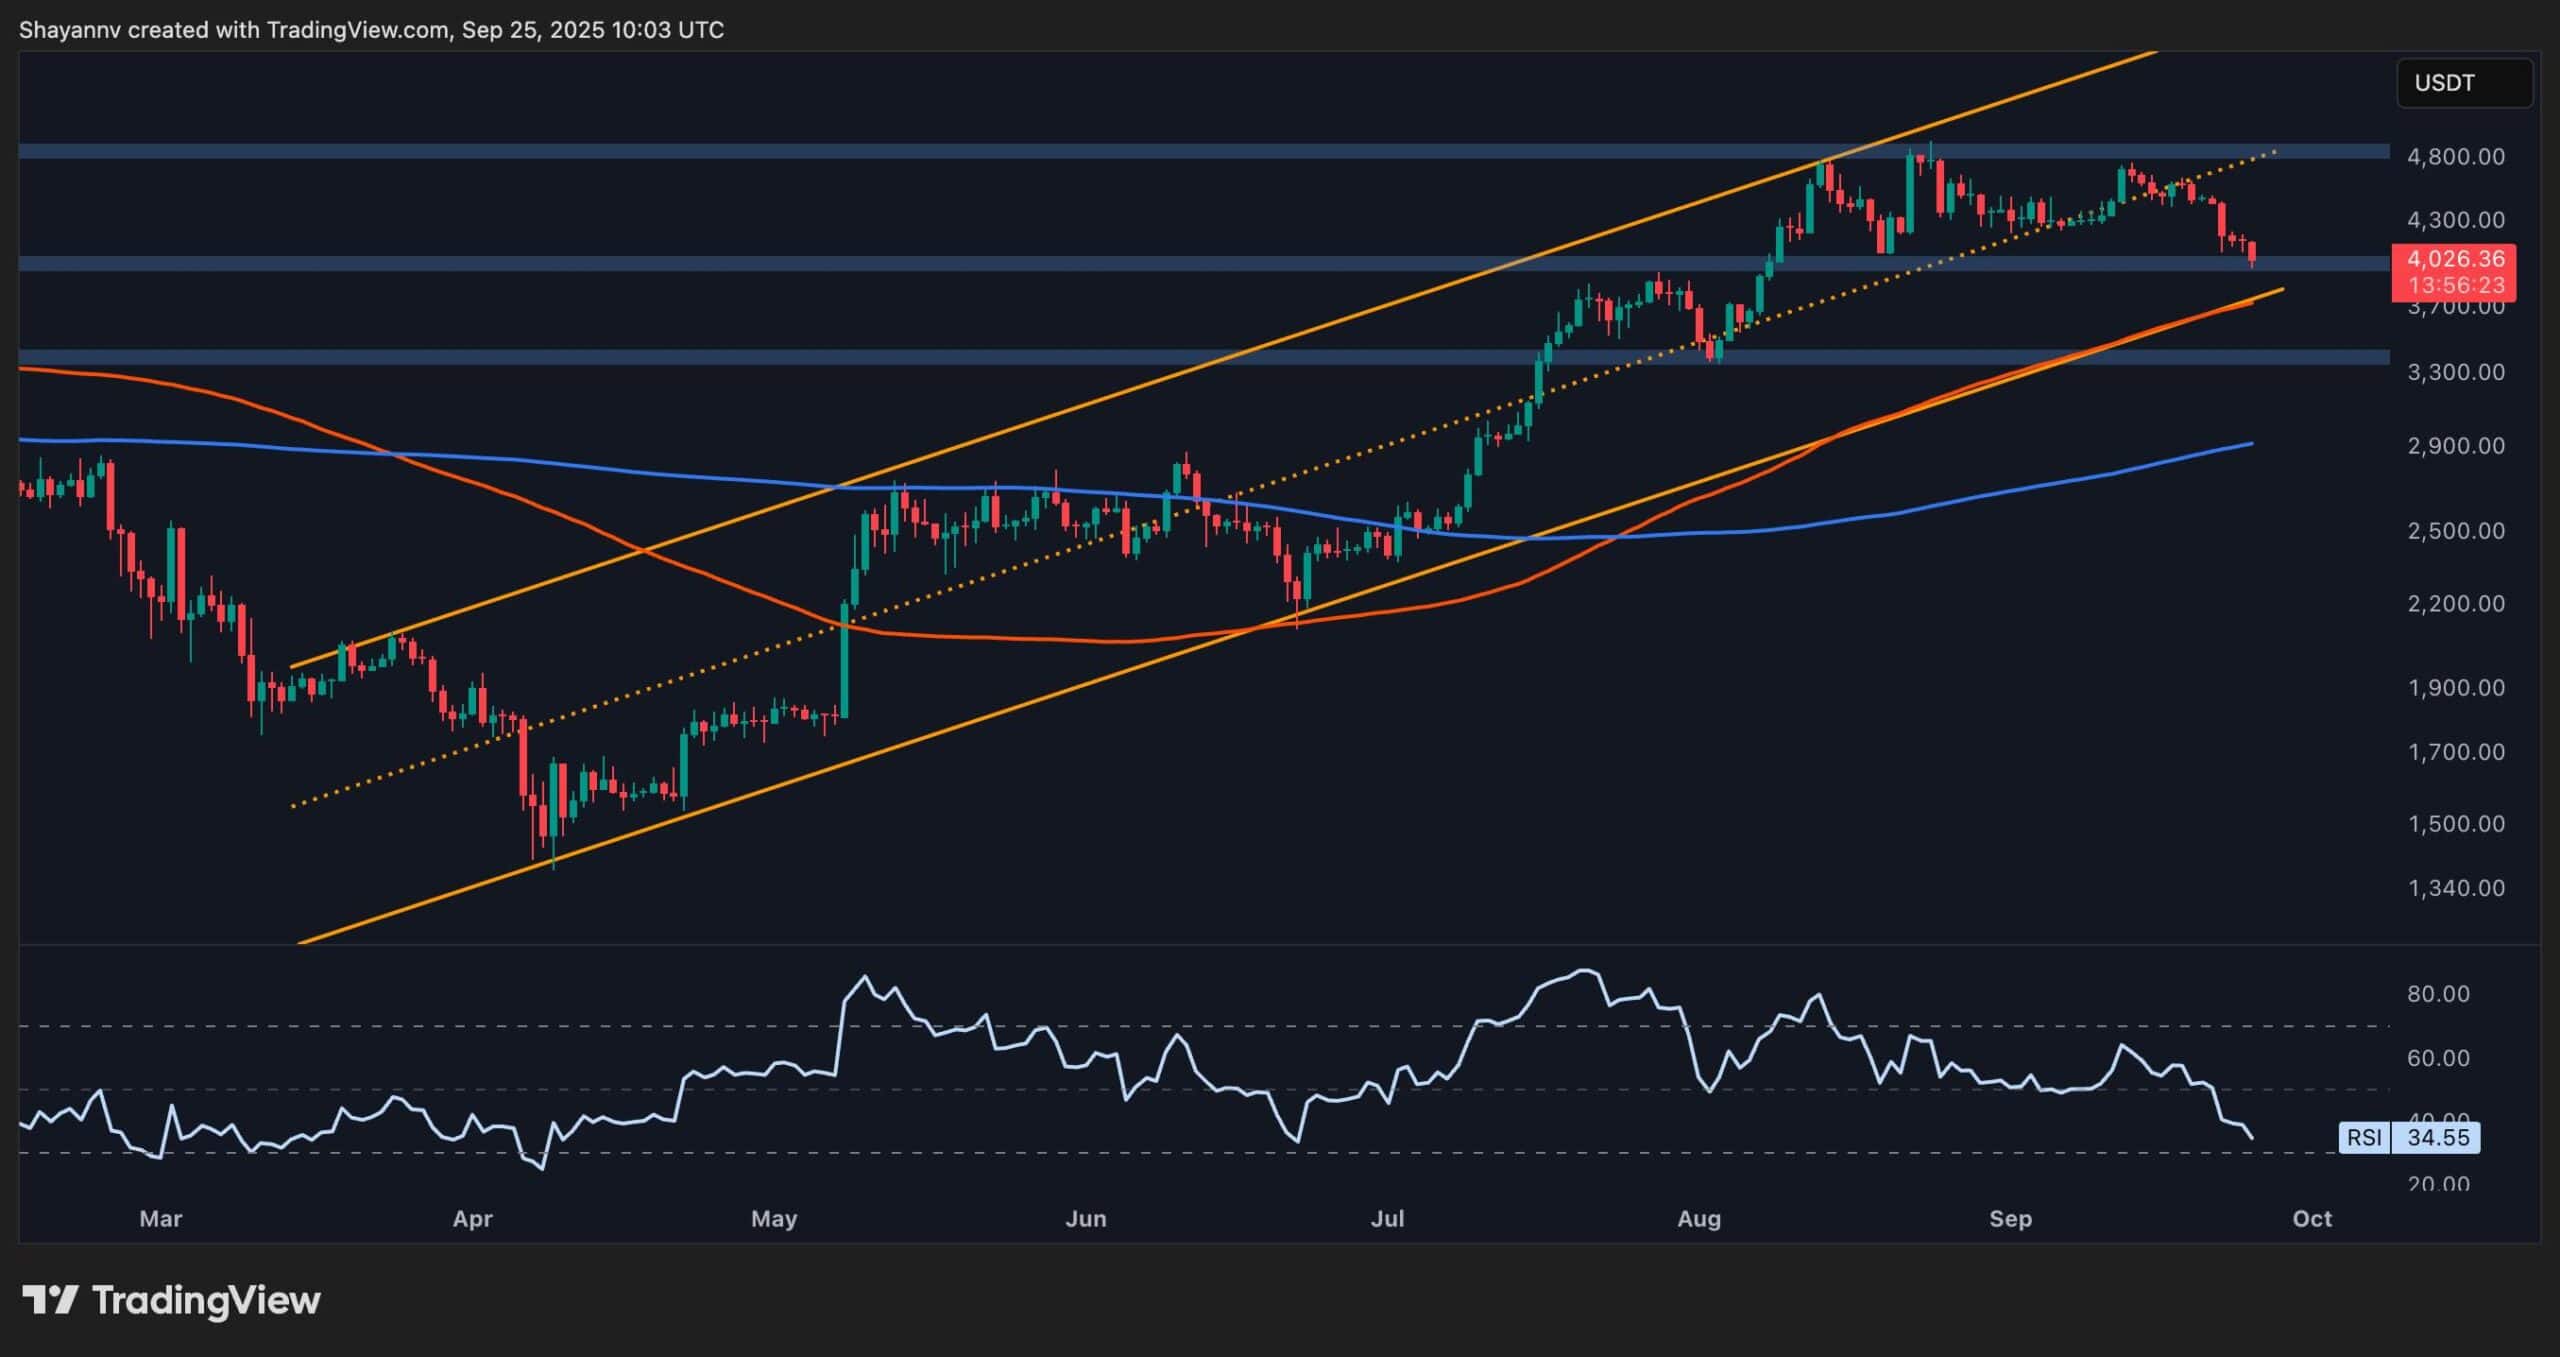
On the daily timeframe, ETH had been climbing inside a clean ascending channel since April, making higher highs and higher lows. However, the recent drop broke below the mid-channel trendline, and the asset is now hovering just above the lower boundary of the channel.
The $3.9K–$4K region is a strong confluence zone, supported by a horizontal demand zone, the 100-day moving average, and the lower boundary of the channel. If this level breaks, the next support lies around $3.4K, followed by the 200-day moving average, which is now located at around $2,900.
The RSI has also dropped to 34, suggesting that bearish momentum is increasing, but ETH is also approaching oversold conditions, where a bounce becomes more likely.
The 4-Hour Chart
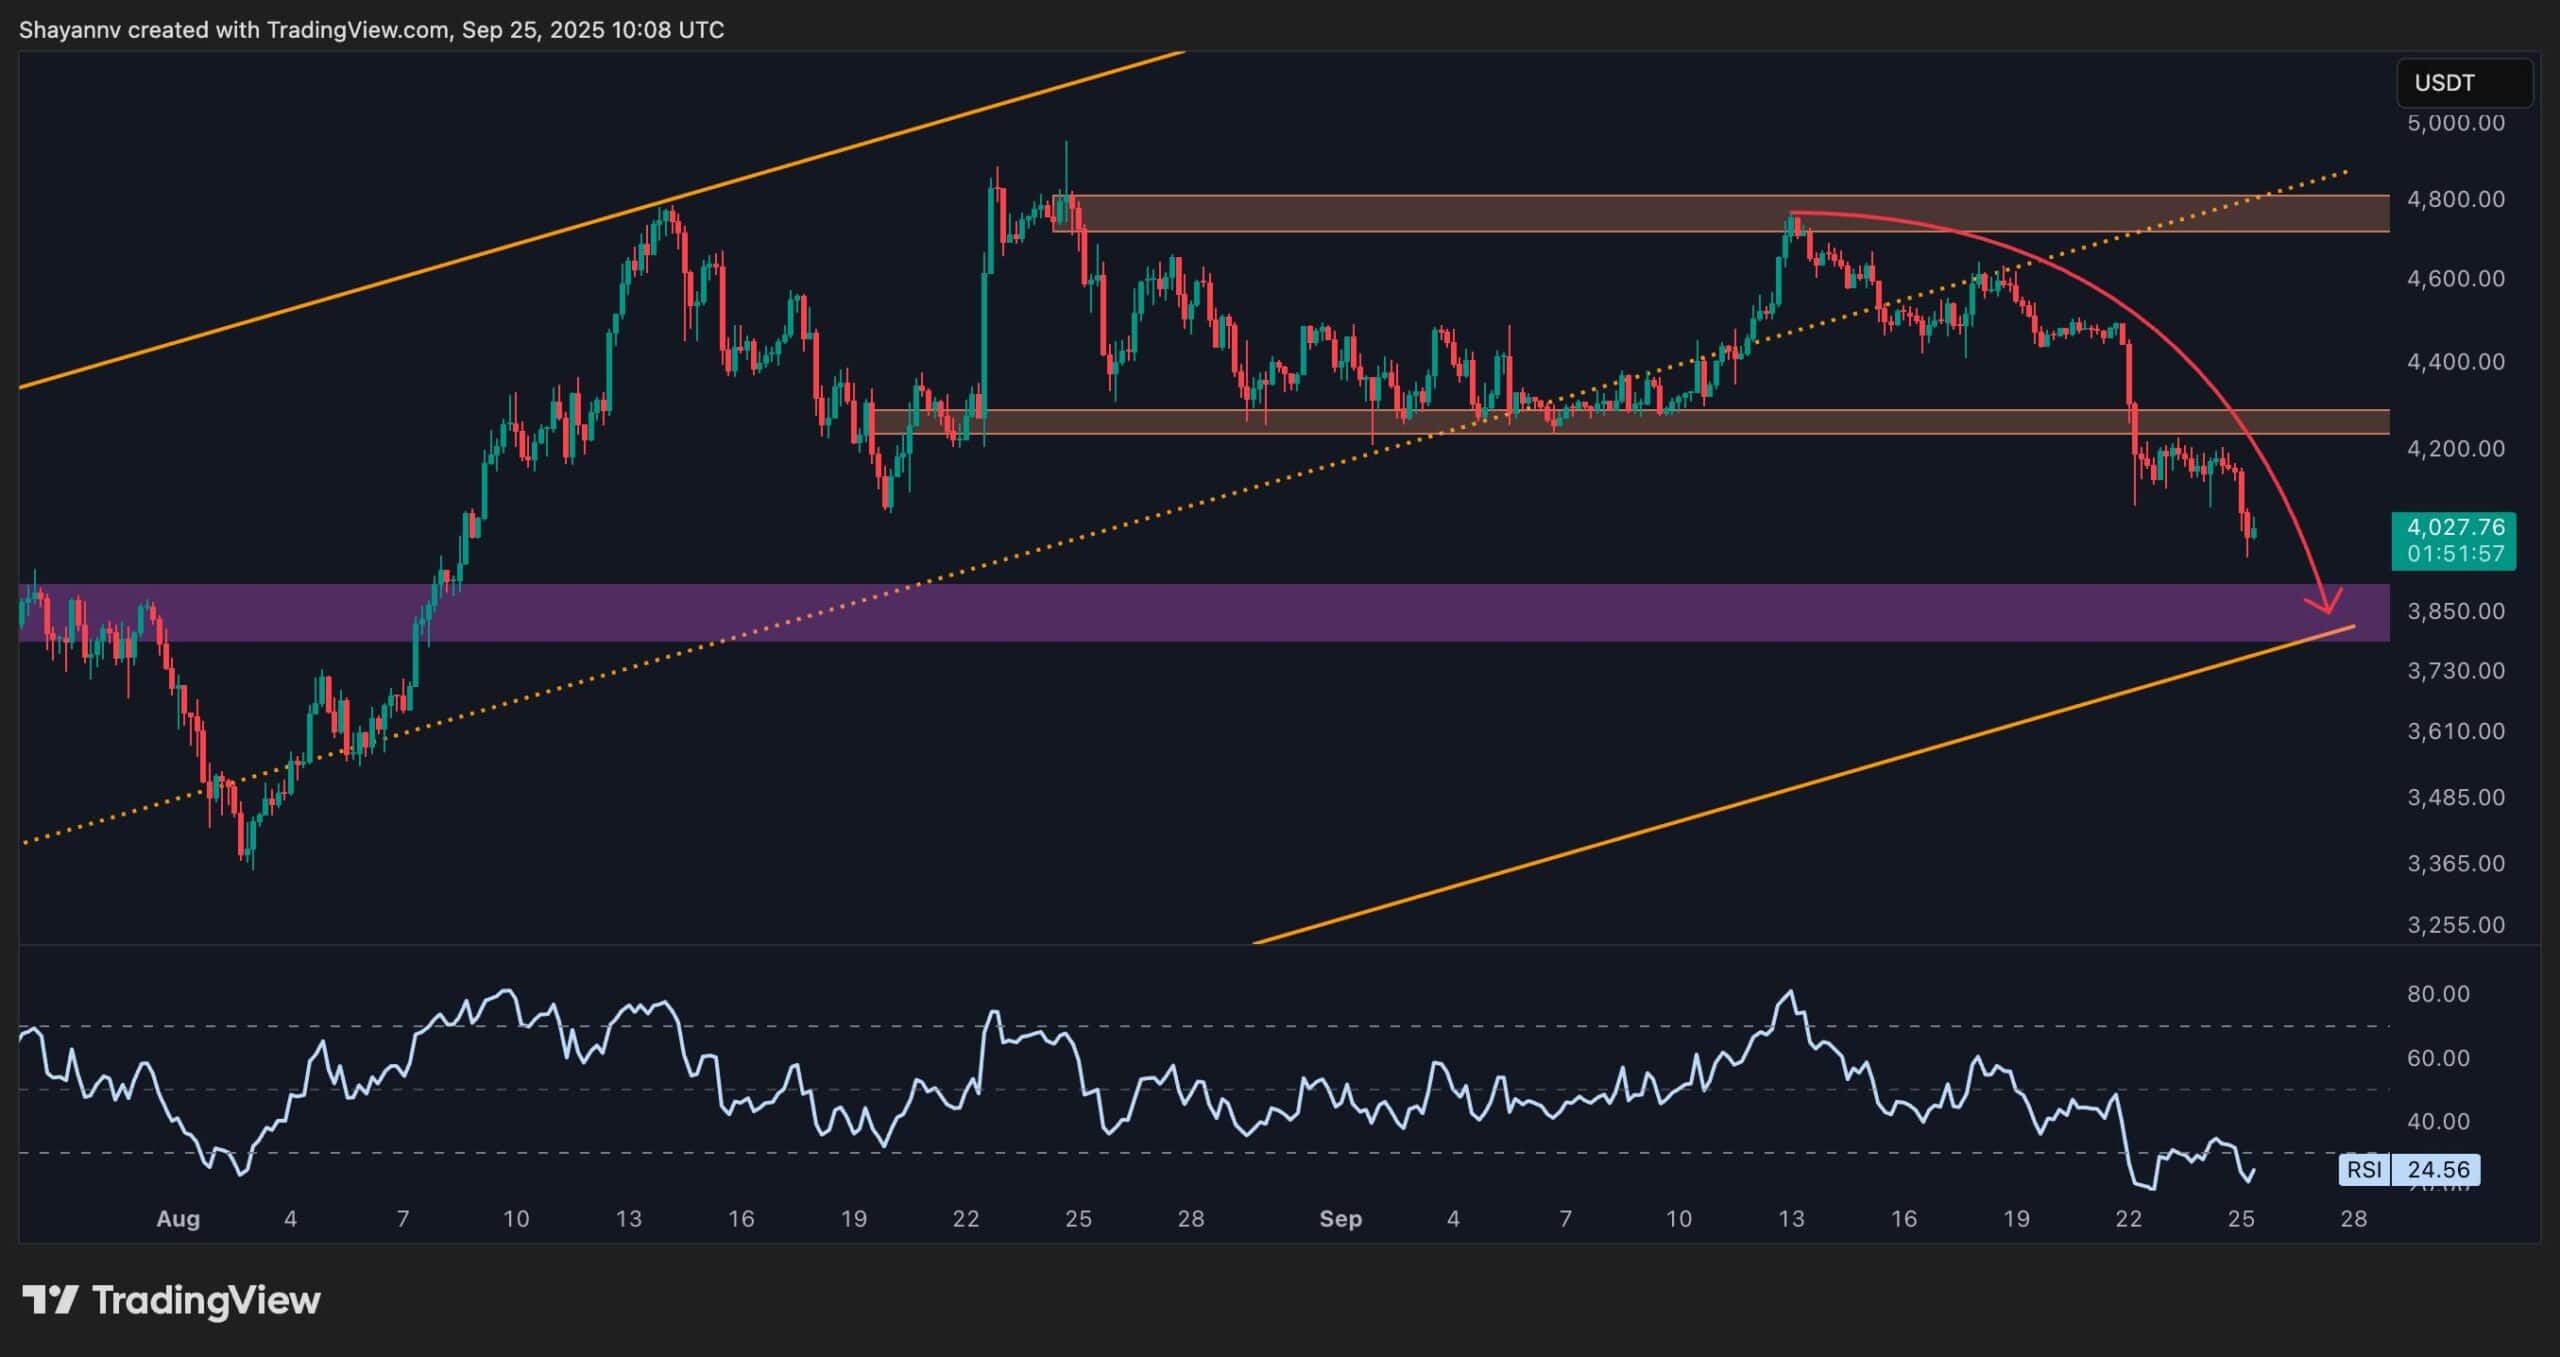
Zooming into the 4-hour timeframe, the structure looks clearly bearish in the short term. The price has broken below a key support at $4.2K and is currently following a parabolic correction path. Momentum is weak, and the RSI is deeply in the oversold region, sitting NEAR 24, which could lead to a relief bounce soon.
That said, unless ETH reclaims the $4.2K–$4.3K area and forms a local higher high again, the bias remains bearish. All eyes are now on the $3.8K-$4K zone, a critical level that could either trigger a strong rebound or open the doors for a further drop toward $3.5K or even lower.
Sentiment Analysis
Open Interest
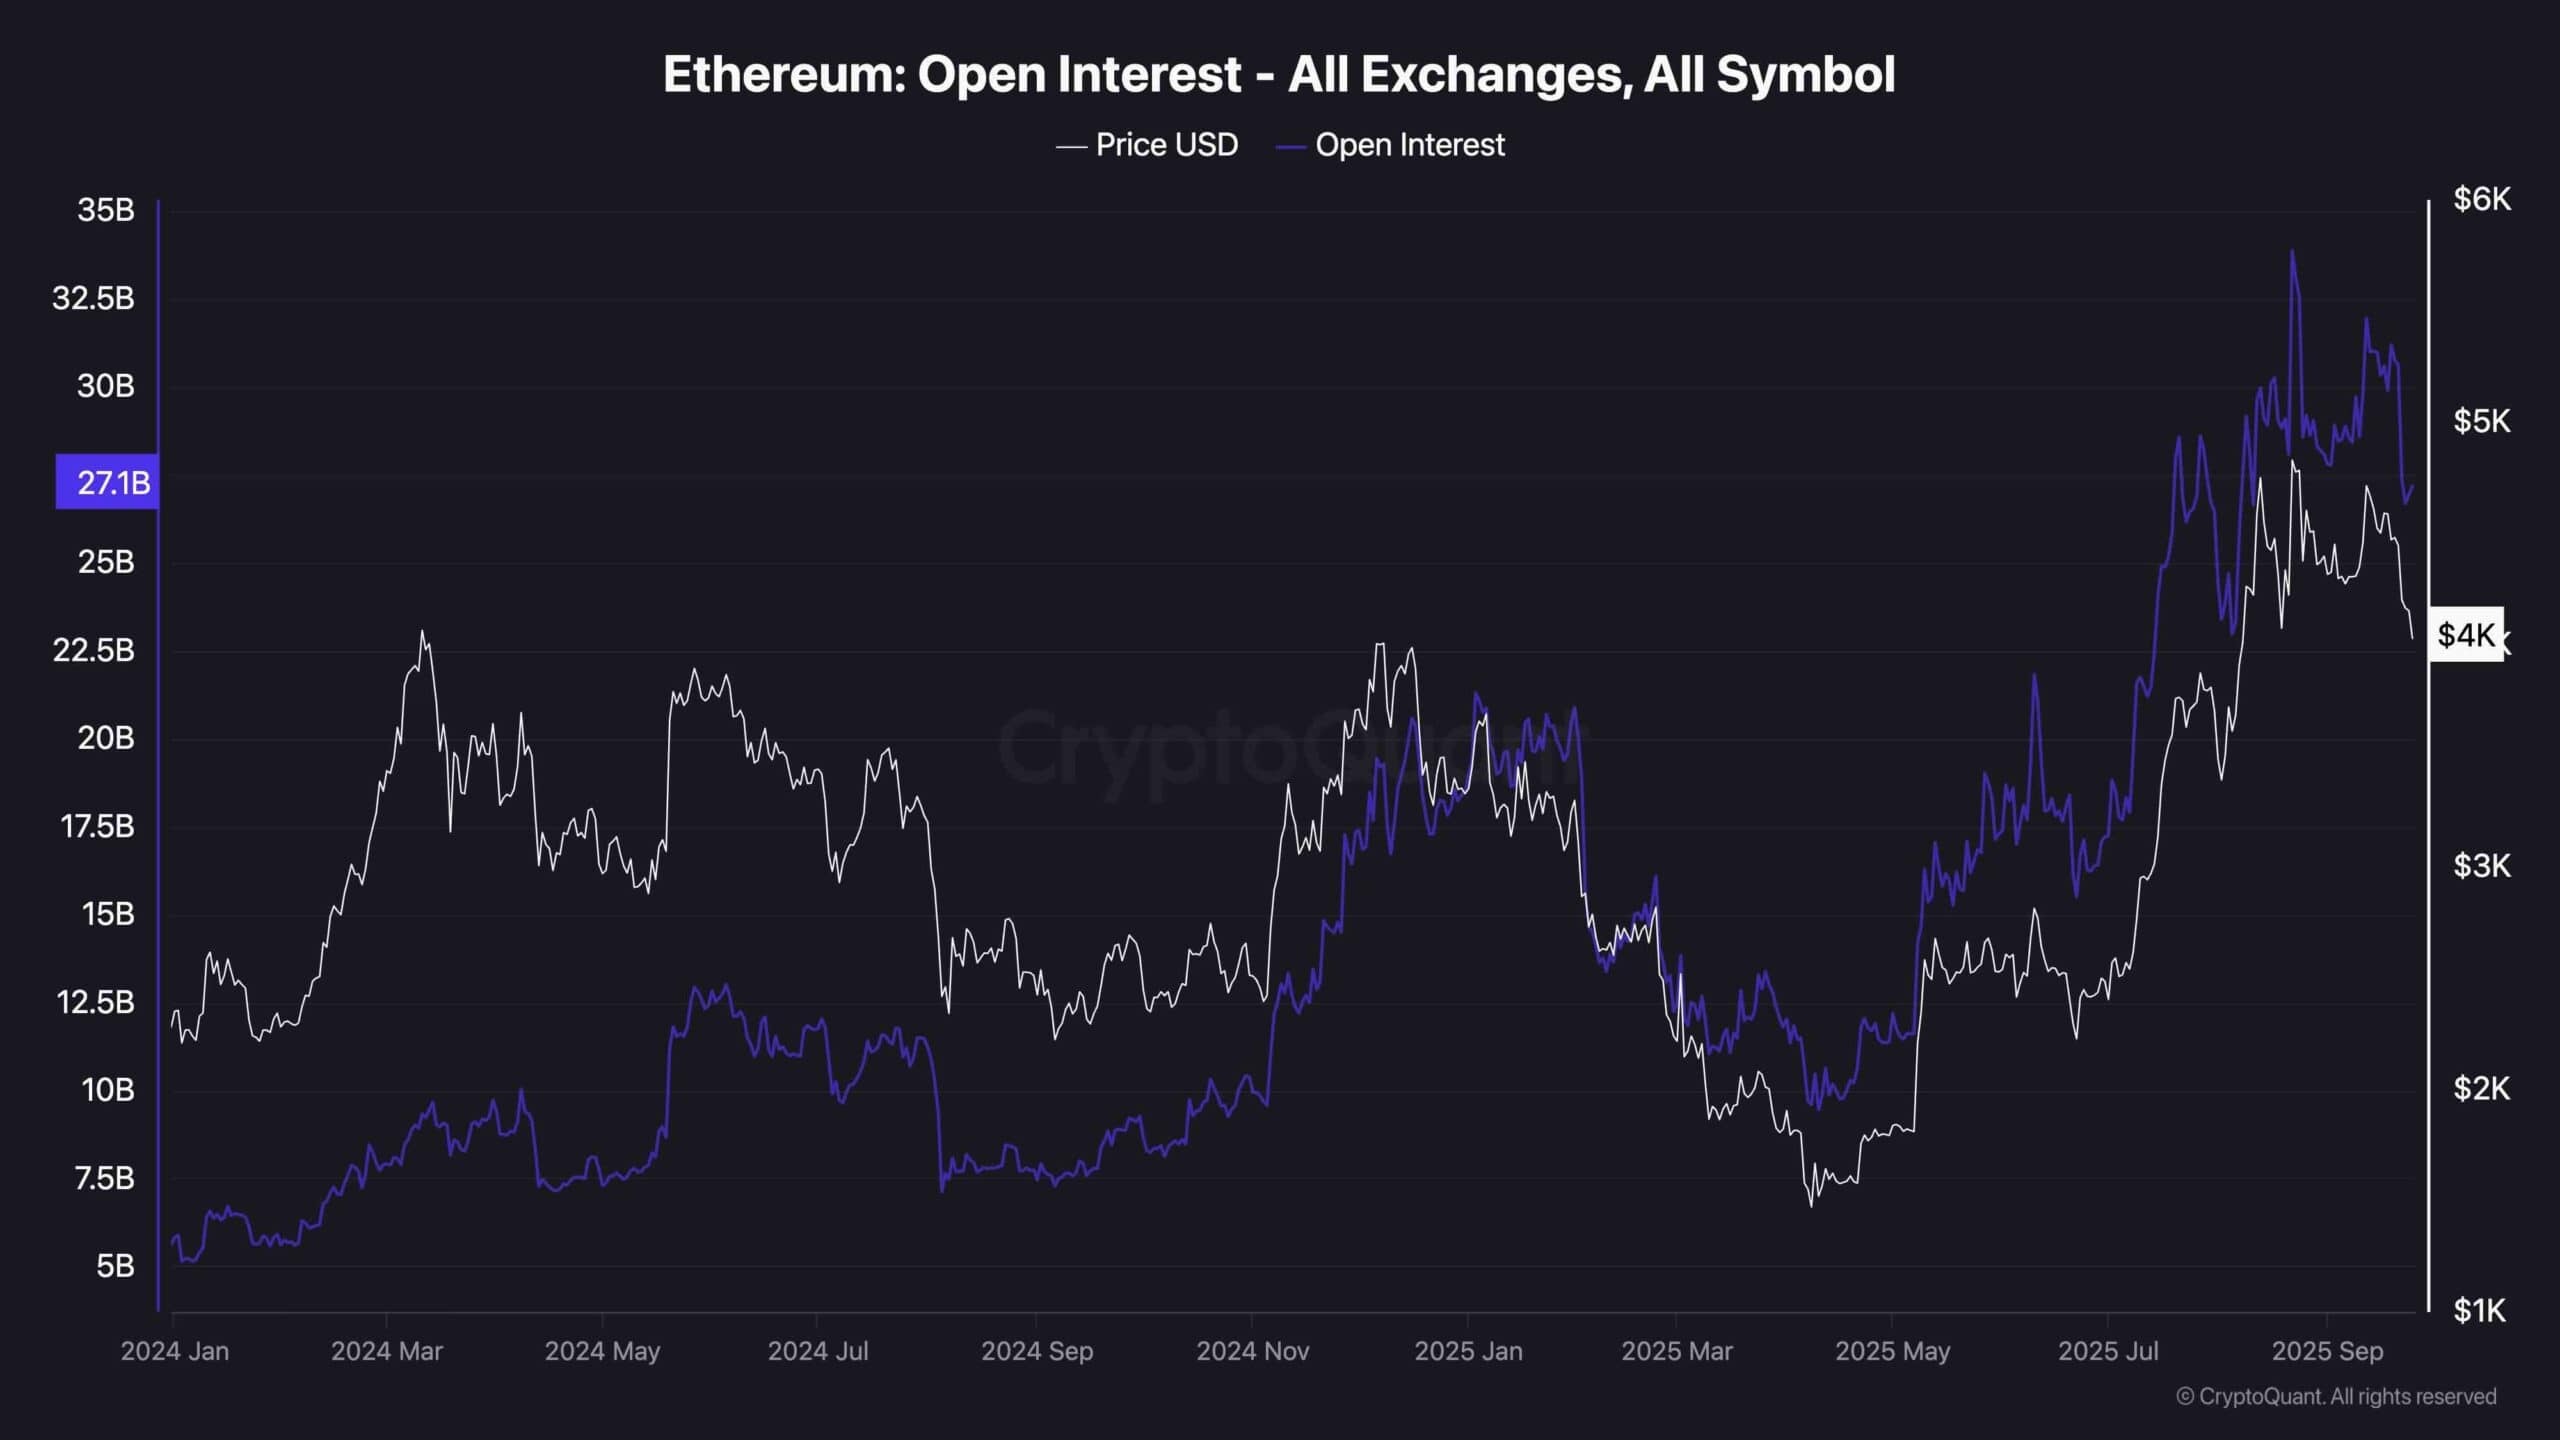
Ethereum’s open interest has dropped significantly following the recent price decline, showing that many Leveraged long positions have been wiped out during this correction. However, despite the pullback, open interest remains elevated compared to earlier this year.
This suggests there’s still a considerable amount of speculative activity in the market. The sharp reduction in OI signals reduced the immediate risk of a major liquidation cascade, but the elevated baseline indicates traders are still positioning for volatility. If price stabilizes around key support and sentiment improves, we could see OI climb again alongside a potential bounce.