Dogecoin’s Explosive Bounce Fuels Wyckoff Rally Optimism for 2025

Meme coin defies gravity as classic accumulation pattern signals potential breakout.
Wyckoff's Revenge
Traders spot textbook springboard formation after Dogecoin's 30% surge—the kind of move that makes technical analysts drool. Volume confirms institutional interest, with whales accumulating at key support levels. This isn't just retail FOMO anymore.
Market Mechanics Unleashed
The Wyckoff method—developed when ticker tape still existed—somehow predicts crypto movements better than most modern algorithms. Distribution phases give way to markup rallies, creating those parabolic moves degens dream about. Dogecoin's breaking through resistance levels like they're made of tissue paper.
When Memes Meet Method
Combining Elon Musk tweets with century-old technical analysis feels like mixing champagne with cheap beer—somehow it works. The 2025 crypto landscape rewards assets with both community hype and solid chart structures. Dogecoin's got both, leaving fundamental analysts scratching their heads while traders bank gains.
Just remember: in crypto, even the most sophisticated patterns can get wrecked by a single whale dump—because nothing says 'efficient markets' like one dude crashing your entire thesis with a mouse click.
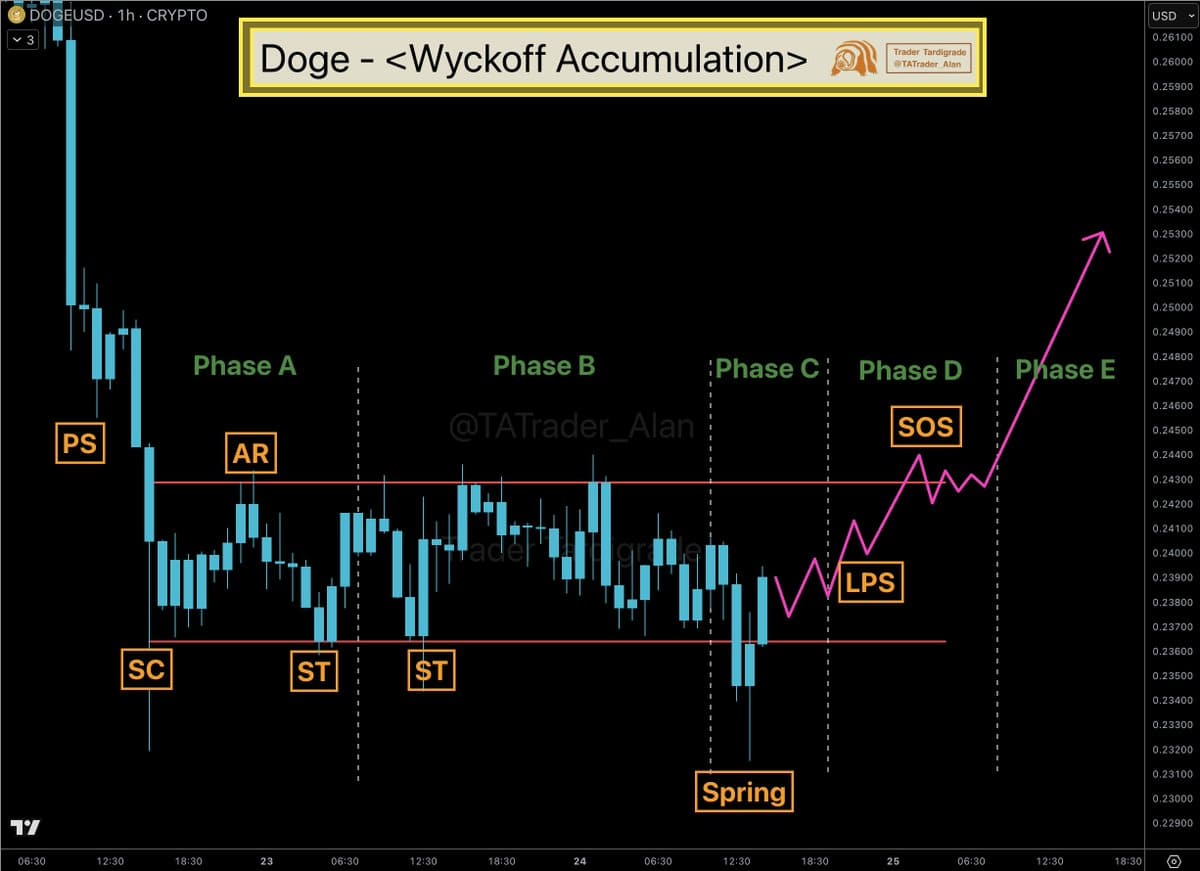
Wyckoff Pattern Points to Short-Term Recovery
Dogecoin is showing signs of following a Wyckoff Accumulation pattern on the 1-hour chart. Analysis shared by Trader Tardigrade shows the market moving through phases A and B, where support and resistance levels were tested repeatedly.
Notably, the current move appears to be Phase C, which includes a “Spring.” This is a dip below support that often clears weaker positions before a rebound. Price has bounced from this level, suggesting the possible start of Phase D. If the structure continues to unfold, Dogecoin may see a Last Point of Support followed by a Sign of Strength. The chart projection points to a potential push toward $0.25.
On the daily time frame, dogecoin is trading inside a rising wedge pattern. The lower line has tracked higher lows since June, while the upper line connects the highs reached in May and September. Price recently pulled back after testing resistance near $0.30 to $0.32.
The projection shows price consolidating around $0.24 to $0.25 before another attempt to break higher. If the wedge holds, a retest of $0.30 is possible.
A drop below the lower wedge line WOULD shift attention to $0.22 as support.
Large Holders Increase Supply Share
Santiment data shows shifts in Dogecoin supply held by major wallet groups. The 100 million to 1 billion Doge group (yellow line) has been adding steadily since August 2025. Their share has risen to about 16.93% of supply, the highest level shown on the chart.
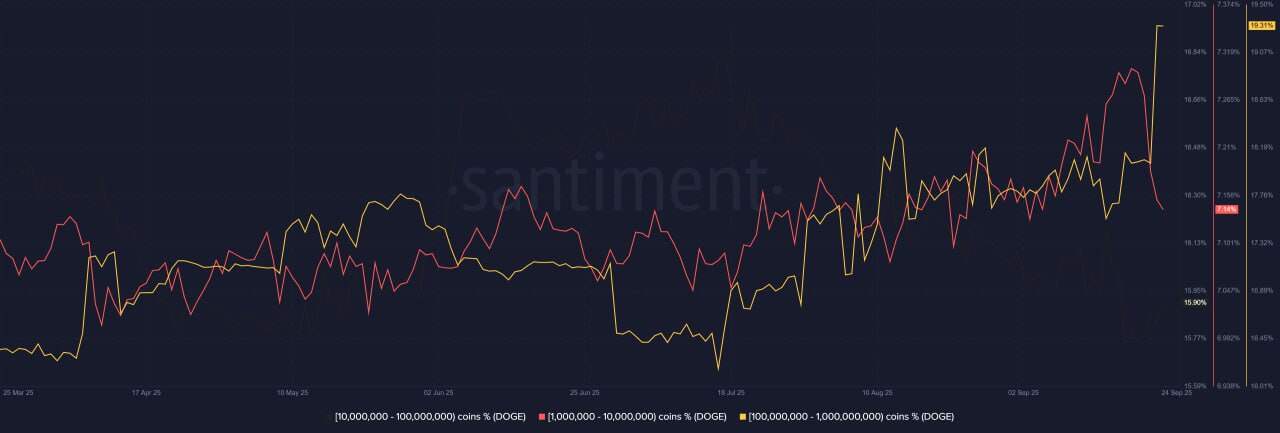
The 1 million to 10 million DOGE group (red line) expanded its share through September, peaking NEAR 17.6%. Toward the end of the month, this group reduced slightly, suggesting some profit-taking. The data shows the largest whales continue to build positions while smaller groups are less consistent.
Active Addresses Return to Normal Range
Daily active addresses for Dogecoin usually sit between 20,000 and 120,000. Days in the middle of May and late June 2025 showed an exception when activity spiked to over 800,000 and 500,000 addresses, respectively.
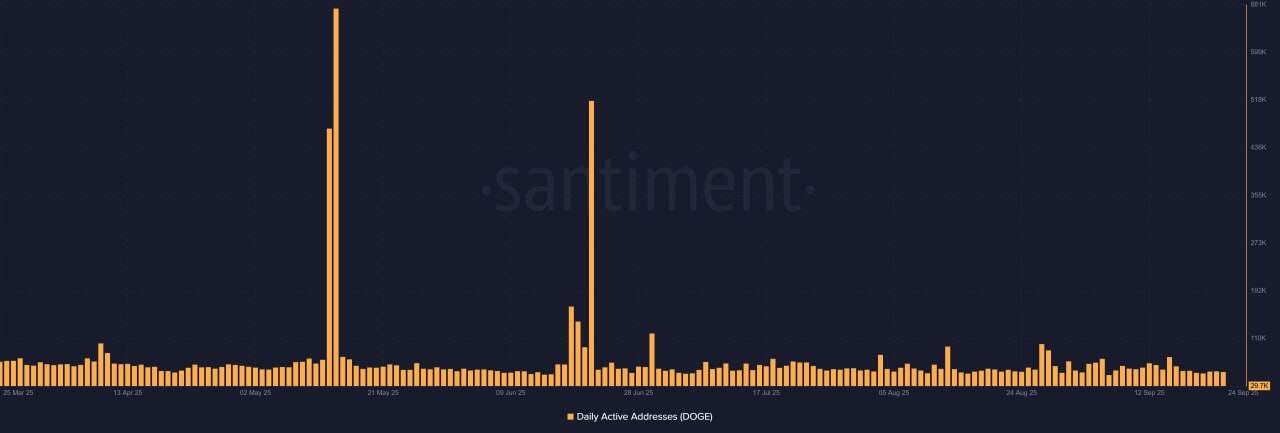
By late September, the number fled back to around 29,700. This means that these spikes may have been short-term dirt, and in general, usage has creeped back into stable ranges.
