Ripple’s (XRP) 21 EMA Signal Flashes Bullish - Massive Rally Imminent

XRP's technical setup just triggered a signal that historically precedes major price explosions.
The 21-Day EMA Breakout
Ripple's chart shows the 21-day exponential moving average acting as springboard rather than resistance—a classic indicator institutional traders watch for entry points. This isn't just another blip on the radar; it's the same pattern that preceded XRP's 2017 and 2021 parabolic moves.
Market Mechanics at Play
When EMA crossovers gain momentum, they create algorithmic buying pressure that feeds on itself. Hedge funds pile in, retail FOMO follows, and suddenly you've got a textbook bull run. The 21-day period captures short-term sentiment shifts while filtering out market noise—giving clearer signals than weekly or monthly averages.
Regulatory Tailwinds
With the SEC case fading in the rearview, XRP's fundamentally stronger position than during previous cycles can't be ignored. The token now trades on major US exchanges while competitors face regulatory uncertainty—an advantage that could multiply gains when the next crypto wave hits.
Timing the Breakout
Historical data suggests EMA confirmations typically lead to 30-50% moves within two weeks when volume confirms the trend. This time, with overall crypto market cap testing all-time highs, the upside potential looks even more aggressive.
Of course, traditional finance pundits will call it speculation right up until they quietly allocate 2% of their portfolio 'for diversification.' Sometimes the charts speak louder than the suits.
XRP Maintains Historical Pattern Around 21 EMA
Recent technical analysis suggests XRP may be preparing for a strong move. EGRAG crypto has pointed to the 21-week Exponential Moving Average (EMA) as a level that has played a key role in past XRP cycles.
In 2017, the token tested the 21 EMA twice before rising by over 1,600%. During 2021, despite an initial drop below this level, partly influenced by the SEC case, XRP later closed above the 21 EMA, retested it, and moved up by more than 400%. EGRAG now identifies a similar situation following a retest of the 21 EMA on June 9, 2025.
Using the past two moves as references, EGRAG outlines two potential price levels. A move similar to the 2021 cycle WOULD place XRP around $9.60, while a 2017-style run could send it as high as $33. These figures are not predictions but calculated projections based on percentage gains seen after previous 21 EMA retests, they said.
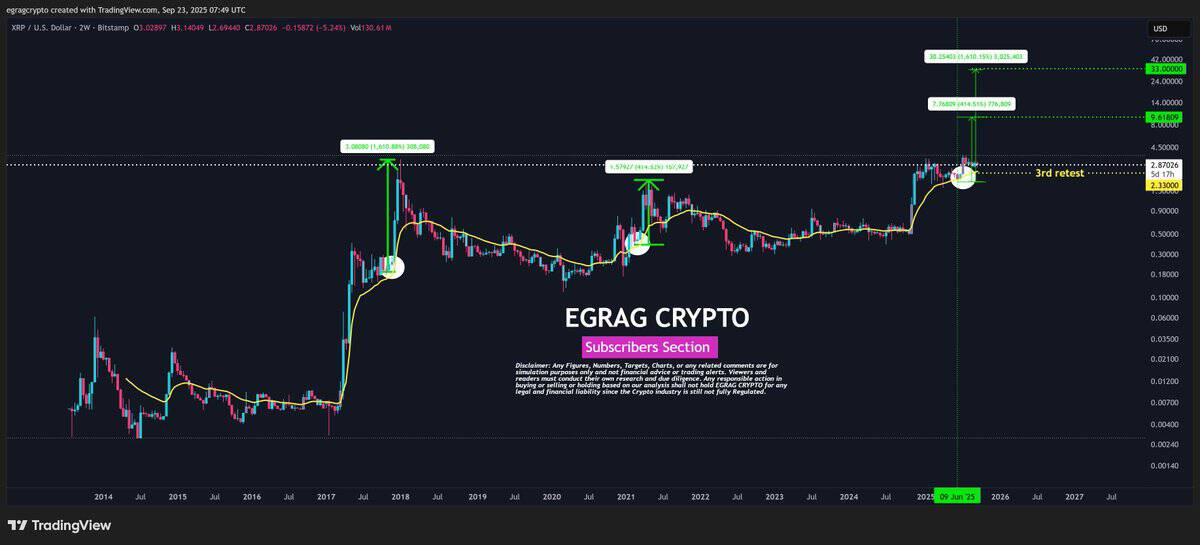
The chart does not suggest a timeline for such moves. The idea is that if current conditions hold, especially price stability above the 21 EMA, XRP could follow the same pattern it has in previous bull cycles.
Long-Term Chart Structure Resembles Previous Cycles
Another chart from EtherNasyonaL tracks XRP’s macro structure, showing price action from 2013 through 2025. The layout points to repeated patterns: long sideways periods followed by steep upward moves. XRP’s past highs from 2013 ($0.06), 2017 ($3.31), and 2021 ($1.97) are marked as supply zones where previous rallies paused.
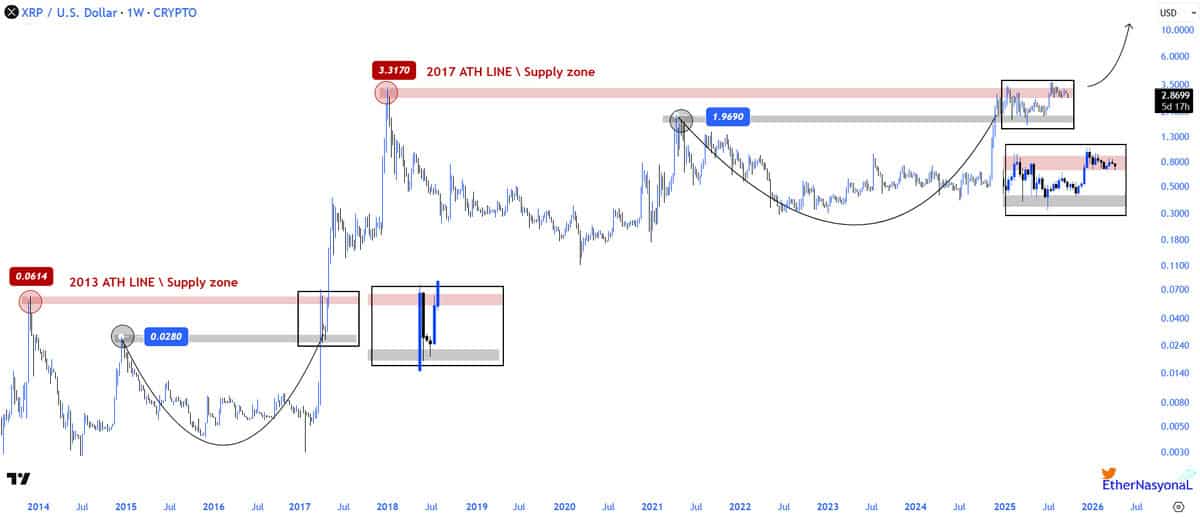
As of now, XRP is trading just below the 2017 high. The current price action shows a rounding structure that matches earlier setups. The asset is consolidating in a boxed zone, which mirrors how it behaved before breaking out in past cycles.
If the asset moves above the $3.31 area, the next range could fall between $6 and $10. This assumption is based on visual pattern repetition over multiple cycles.
$2.71 Identified as Key Short-Term Level
Analyst Ali Martinez shared a 4-hour chart that focuses on short-term movement. XRP is trading above $2.71, a level it has tested multiple times. According to the chart, this price has acted as a strong support zone since early September.
The asset is currently NEAR $2.81. The chart indicates a potential path for XRP to rise to $3.20 and then to $3.60, provided support continues to hold.
A drop below $2.71 would challenge this setup. The current structure depends on buyers maintaining strength at this level.
