TON Price Forecast 2025-2031: Analyzing the Potential for $100

As of April 2025, the Toncoin (TON) market exhibits dynamic trends, prompting investors to evaluate its long-term trajectory. This analysis explores key factors influencing TON’s valuation, including network adoption, technological developments, and macroeconomic conditions. Technical indicators suggest potential resistance levels, while fundamental metrics assess ecosystem growth. Market sentiment, regulatory frameworks, and competitive positioning against Layer 1 alternatives will critically determine whether TON can achieve triple-digit valuation by 2031. Professional traders monitor Fibonacci extensions and institutional inflow patterns to gauge breakout probabilities beyond psychological price barriers.
Overview
| Cryptocurrency | Toncoin |
| Symbol | TON |
| Current Toncoin price | $2.86 |
| Toncoin market cap | $7.18B |
| Trading volume | $141.43M |
| Circulating supply | 2.5B |
| All-time high | $8.24 on Jun 15, 2024 |
| All-time low | $0.3906 on Sep 20, 2021 |
| 24-hour high | $2.97 |
| 24-hour low | $2.82 |
Toncoin price prediction: Technical analysis
| Metric | Value |
| Volatility (30-day variation) | 10.95% |
| 50-day SMA | $3.30 |
| 200-day SMA | $4.76 |
| Sentiment | Bearish |
| Fear and Greed Index | 29 (Fear) |
| Green days | 15/30 (50%) |
Toncoin price analysis: TON’s price momentum slows
On April 16, the TON price dropped by 3.12% in 24 hours. The move came as Bitcoin fell below $85,000.
After reaching the local high of $6 in early December, the TON price went on a steady decline. On Tuesday, March 11, it dropped beneath the $2.5 mark for the first time in over a year. Afterwards, it started recovering, albeit gradually.
Looking at its DeFi ecosystem, TON’s Total Value Locked (TVL) dropped below $145M.
TON/USD 1-day chart price analysis
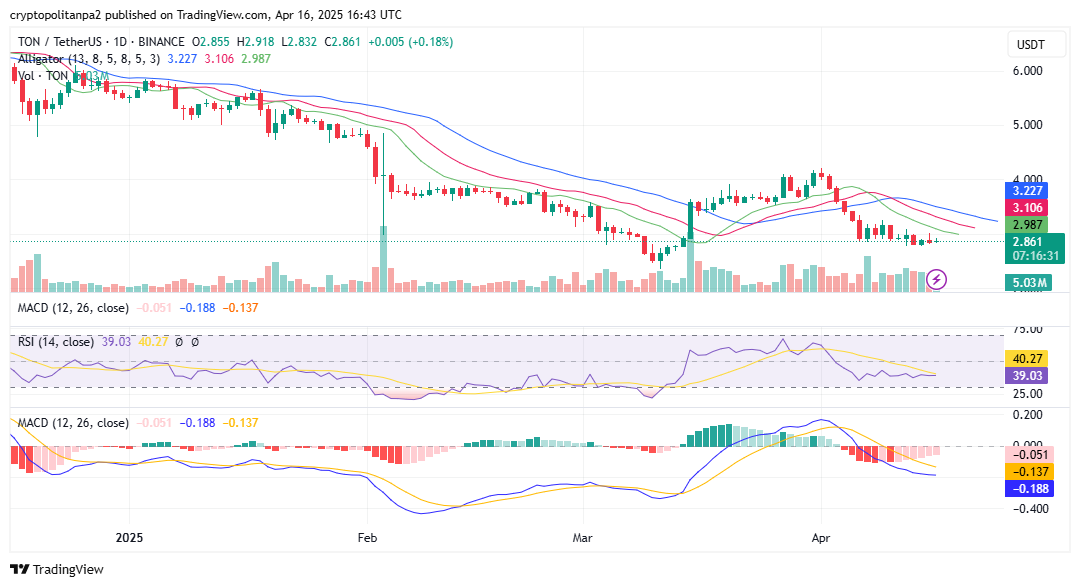 TON/USD 1-day chart. Image Source: TradingView
Building up to a dropping TVL, Toncoin proceeded in a downward channel that started earlier this month and shows signs of rising volatility, as shown by the William Alligator trendlines. The MACD histograms show that its negative momentum has slowed over the last 7 days. Notably, the relative strength index shows it is in neutral territory and is now at 39.03. It is considered oversold when its value drops below 30.
TON/USD 4-hour chart price analysis
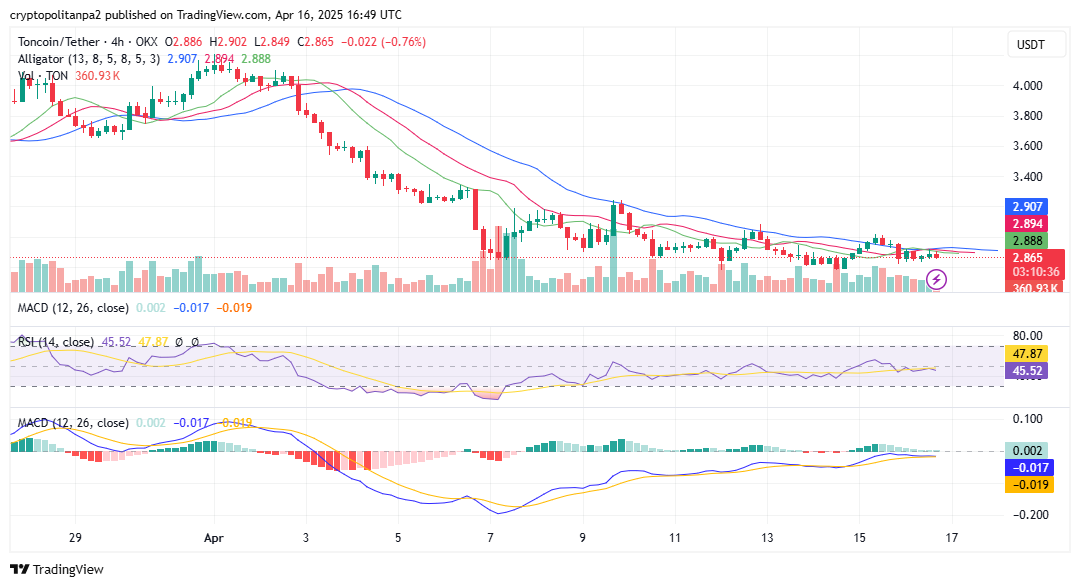 TON/USD 4-hour chart. Image Source: TradingView
The 4-hour chart shows that TON is moving sideways. The William Alligator trendlines show that the coin’s volatility has dropped. Notably, it registers little momentum on this timeframe.
Toncoin technical indicators: Levels and action
Daily simple moving average (SMA)
| Period | Value ($) | Action |
| SMA 3 | 2.94 | SELL |
| SMA 5 | 3.03 | SELL |
| SMA 10 | 3.11 | SELL |
| SMA 21 | 3.39 | SELL |
| SMA 50 | 3.30 | SELL |
| SMA 100 | 3.92 | SELL |
| SMA 200 | 4.76 | SELL |
Daily exponential moving average (EMA)
| Period | Value ($) | Action |
| EMA 3 | 3.02 | SELL |
| EMA 5 | 3.13 | SELL |
| EMA 10 | 3.32 | SELL |
| EMA 21 | 3.43 | SELL |
| EMA 50 | 3.57 | SELL |
| EMA 100 | 3.99 | SELL |
| EMA 200 | 4.53 | SELL |
What to expect from TON price analysis next?
Our chart analysis shows the current sentiment is bearish, with the Fear and Greed Index showing fear among investors. The charts show that TON’s momentum is now slowing down, meaning it should trade sideways over the short term.
Is TON a good buy?
According to Cryptopolitan price predictions, TON is set to trade higher in the years to come. However, factors like market crashes or difficult regulations could invalidate this bullish theory.
Why is TON down?
The drop in TON value could be attributed to the drop in the crypto market and its waning TVL.
Will TON reach $10?
Yes, TON should rise above $10 in 2027. The move will come as the market recovers to previous highs.
Will TON reach $100?
Per the Cryptopolitan price prediction, TON is unlikely to reach $100 before 2031.
Will TON reach $1,000?
Per the Cryptopolitan price prediction, TON is unlikely to reach $1000 before 2031.
Does Toncoin have a future?
TON has had a bullish run since its inception despite seasonal market corrections. The TON blockchain has a vibrant community of users and developers. Looking ahead, Toncoin has the potential to trade higher in the coming years.
How much will a Toncoin be worth in 2030?
The TON price prediction for 2030 indicates the price will range between $28.31 and $34.81. The average price of Toncoin will be $29.16.
Recent news/opinion on TON
The launch of TON Testnet on ZetaChain will now bring The Open Network’s capabilities with ZetaChain, potentially increasing the utility and demand for both TON and ZETA tokens. If the integration is adopted widely, it could drive substantial network growth, enhancing the value proposition of the involved tokens.
TON price prediction April 2025
The TON April price prediction ranges from $2.44 to $3.50. It will average at $2.73.
| Period | Potential low ($) | Potential average ($) | Potential high ($) |
| April | 2.44 | 2.73 | 3.50 |
TON price prediction 2025
As 2025 unfolds, TON remains bullish, as evidenced by the price registering higher highs. The price will range between $2.02 and $6.35. The average price for the month will be $4.23.
| Year | Potential low ($) | Potential average ($) | Potential high ($) |
| 2025 | 2.02000 | 4.23000 | 6.35000 |
TON price prediction 2026 – 2031
| Year | Potential low ($) | Potential average ($) | Potential high ($) |
| 2026 | 6.58000 | 6.80000 | 7.71000 |
| 2027 | 9.26000 | 9.60000 | 11.49000 |
| 2028 | 13.84000 | 14.22000 | 16.29000 |
| 2029 | 20.71000 | 21.27000 | 23.42000 |
| 2030 | 28.31000 | 29.16000 | 34.81000 |
| 2031 | 41.21000 | 42.37000 | 48.12000 |
TON price prediction 2026
The year 2026 will experience more bullish momentum. According to the TON price prediction, it will range between $6.58 and $7.71, with an average trading price of $6.80.
TON price prediction 2027
The TON token prediction climbs even higher into 2027. According to the prediction, Toncoin’s price will range between $9.26 and $11.49, with an average price of $9.60.
TON price prediction 2028
The analysis suggests a further acceleration in TON’s price. TON will trade between $13.84 and $16.29. It will average at $14.22.
TON price prediction 2029
According to the TON price prediction for 2029, the price of TON will range between a minimum of $20.71, a maximum of $23.42, and an average of $21.27.
TON price prediction 2030
The TON price prediction for 2030 indicates the price will range between $28.31 and $34.81. The average price of Toncoin will be $29.16.
TON price prediction 2031
The Toncoin price forecast for 2031 set the high at $48.12. However, when the market corrects, TON will reach a minimum price of $41.21 and an average of $42.37.
 TON price prediction 2025 – 2031
TON market price prediction: Analysts TON price forecast
| Platform | 2025 | 2026 | 2027 |
| Digitalcoinprice | $7.30 | $9.27 | $12.65 |
| Coincodex | $9.78 | $6.57 | $3.84 |
| Gate.io | $3.73 | $4.32 | $4.60 |
Cryptopolitan TON price prediction
Our predictions show TON will achieve a high of $6.35 in 2025. In 2027, it will range between $9.26 and $11.49, with an average of $9.60. In 2030, it will range between $28.31 and $34.81, with an average of $29.16. Note the predictions are not investment advice. Seek independent professional consultation or do your research.
TON historic price sentiment
 Ton price history. Image source: CoinStats
- Ton network launched in 2018 as the Telegram Open Network (TON) but was later renamed “The Open Network” and taken over by the TON Foundation.
- In June 2020, all Toncoin tokens (98.55% of the total supply) became available for mining.
- The tokens were placed in special Giver smart contracts, enabling anyone to mine until 28 June 2022. Users mined around 200,000 TON daily.
- All the tokens were mined in two years, marking the completion of the distribution event.
- On September 20, 2021, TON registered its all-time low price at $0.3906.
- Its first significant break came in November 2021. In days, the coin slid from $0.8 to $4.5.
- It corrected in 2022, reaching a low of $0.9.
- In 2023, it ranged between $1.1 and $2.5.
- In 2024, it registered another bull run, rising from $2.11 to its all-time high of $8.24 on Jun 15, 2024.
- It corrected later and traded at the $5.2 mark in October and $4.98 in November when it started recovering.
- The recovery saw the coin rise above $6.5 in December.
- It then crossed into 2025, trading at $5.5. From there, it assumed a bear run as it fell below $3.8 in February and $3.0 in April.
