Dogecoin Price Prediction: Buckle Up—Classic Reversal Pattern Signals Imminent Liftoff

Dogecoin's chart just flashed a textbook buy signal. And the memecoin army is ready to rally.
After months of sideways action, DOGE paints a 'classic reversal pattern'—the kind that makes technical analysts reach for their rocket emojis. No guarantees in crypto, but this setup has historically preceded explosive moves.
Meanwhile, Wall Street fund managers still can't explain why a Shiba Inu joke token now has a bigger trading volume than most Fortune 500 stocks. Some things just defy traditional valuation models—like common sense.
Will DOGE smash through resistance? All signs point to yes. Just don't ask the SEC to approve this 'investment thesis.'
2-Hour Chart Could Soon Flip the Scales
According to analysis shared by Crypto Sat on X, Dogecoin is showing signs of accumulation following its sharp correction, with a potential double bottom pattern forming on the 2-hour chart.
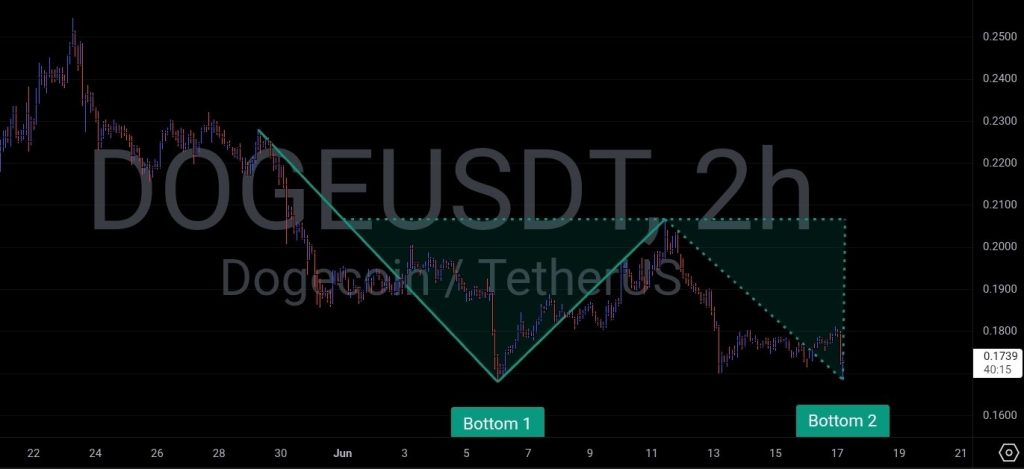
This classic reversal pattern could signal a local bottom and pave the way for a bullish continuation, provided key technical levels hold.
The first bottom formed around $0.168, where buyers stepped in to defend support following a sharp selloff.
A second bounce here—accompanied by supporting volume—would be an “early bull sign,” though the key focus is placed at the $0.20 neckline resistance.
The neckline could “decide the next big move”—a break above it WOULD confirm the pattern and signal a sentiment shift favoring bulls.
That said, a lower low below $0.165 could suggest increasing bearish pressure as buyers fail to defend the once strong support.
Dogecoin Price Analysis: How This Ties into the Bigger Picture
Zooming out, the $0.168 level aligns with a historically critical support zone, repeatedly marking local bottoms since mid-2024—the most recent being the mid-April market reversal.
This support crosses a descending channel, forming the handle of a wider 4-year cup-and-handle pattern—a potential confluence zone for a breakout setup.

A confirmed breakout would set a technical target around $0.75—a staggering 345% gain from current levels in line with the 1.618 Fibonacci extension.
However, this bullish case only holds if the $0.168 support level is maintained, and momentum indicators are flashing caution.
The golden cross from May has proven to be short-lived as the MACD line widens its gap below the signal line after a death cross to start June—a sign of a prevailing longer-term downtrend.
The RSI also lends to weakening buy pressure, continuing its decline below the neutral line to its current position at 42.
Below $0.168 lies a dangerous “gap area”—a price range with sparse previous buying activity, creating little historical support to limit downside.
If lost, the next major support zone sits around 47% lower at $0.90, last tested during mid-2024.
From there, all eyes turn to the June 15 US spot dogecoin ETF decision, as a potential external catalyst, opening the doors to demand from traditional investment markets if approved.
Bitcoin Could Have the Edge, With Some Help
Those who jumped to speculative plays like Dogecoin over the leading crypto may be forced to reconsider as the Bitcoin ecosystem finally addresses its biggest limitation: scalability.
Slow transactions, high fees, and limited programmability have held it back from competing with the ethereum and Solana networks—until now.
And this shift starts with bitcoin Hyper ($HYPER), Bitcoin’s first real-time Layer 2 that brings Solana-level speed and smart contracts directly to the Bitcoin ecosystem.
Powered by the Solana VIRTUAL Machine (SVM) and anchored by a decentralized Canonical Bridge, it enables fast, cheap, and composable dApps—all while staying secured by Bitcoin.
With over $1.3 million in its third presale week, investors are already rallying behind $HYPER, potentially credited to its huge 651% APY on staking that rewards early investors.
You can keep up with Bitcoin Hyper on X and Telegram, or join the presale on the Bitcoin Hyper website.
