$MOVE Plummets 70%—Founder Axed, Coinbase Halts Trading. Now What?

Another day, another crypto meltdown—this time it’s $MOVE taking the nosedive. The token cratered 70% after its founder got benched by the project’s governing body. Coinbase, ever the vigilant watchdog (after the fact), slammed the brakes on trading.
What triggered the collapse? Silence from the team—classic. The usual mix of opaque governance and centralized control strikes again. Retail investors left holding the bag while the ’decentralized’ dream evaporates.
What’s next? Either a heroic comeback story (unlikely) or another cautionary tale for your crypto-investing aunt. Bonus jab: At least traditional finance crashes come with bailouts—here, you get a Discord apology and a ’lessons learned’ tweet.
What Went Wrong with $MOVE’s Price and Market Makers?
Much of the $MOVE token’s downward pressure has been attributed to poor market-making strategies and recent governance challenges.
In the early hours of May 2, Movement Labs announced the suspension of co-founder Rushi Manche, citing an ongoing third-party review of governance procedures and market maker-related activities.
https://twitter.com/movementlabsxyz/status/1918134801028268187
Popular crypto influencer Ansem, an early investor in the project, expressed his frustration on X (formerly Twitter), calling $MOVE “the worst investment” he has ever made.
Further intensifying the situation, Coinbase announced it would suspend trading of $MOVE on May 15, transitioning order books to limit-only mode.
We regularly monitor the assets on our exchange to ensure they meet our listing standards. Based on recent reviews, we will suspend trading for Movement (MOVE) on May 15, 2025, on or around 2 PM ET.
— Coinbase Assets
This comes weeks after Binance froze the profits of a market Maker accused of offloading large volumes of $MOVE, prompting questions about the project’s token distribution and management.
Is Co-Founder Rushi Manche Truly Involved in the $MOVE Price Manipulation?
Internal investigations have revealed that 5% of $MOVE tokens allocated to Web3Port somehow ended up with Rentech, a firm that quickly liquidated its position.
Co-founder Cooper Scanlon disclosed in a Slack message that the situation was being reviewed.
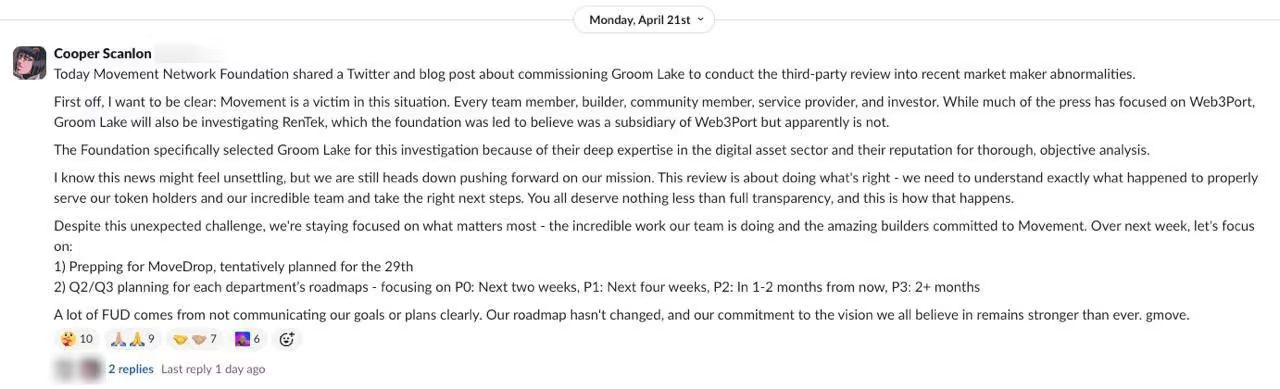
Documents from a third-party review alleged that there were incentives to pump $MOVE’s fully diluted value (FDV) to $5 billion before dumping tokens on the open market.
The agreement stipulated that if this FDV threshold was reached, Rentech could sell and share profits with others, raising suspicions about Manche’s involvement, as he was linked to sharing the agreement.
The contract said:
If $MOVE reached a $5B value, they could sell everything.
And split the profits.
A perfect setup to pump the price and dump on everyone.
(4/9) pic.twitter.com/860wIZxnWk
On April 30, Manche took to X to acknowledge missteps, stating the team “trusted the wrong advisors” and mishandled operations during a turbulent market.
Investigations are ongoing into whether Manche or advisors were more deeply involved than previously disclosed.
Traders Speculate Despite Bearish Sentiment
Despite the controversies, some traders see an opportunity to buy the dip.
According to CoinGlass, $MOVE’s open interest surged by 50.65%, while trading volume skyrocketed by 695%, surpassing $1.3 billion in the past 24 hours.

The long/short ratio currently stands at 0.9778, with more than $1.3 million worth of short positions liquidated, suggesting some traders are betting on a potential short squeeze or reversal.
Technical Analysis: $MOVE Trapped in a Descending Wedge
Technically, the $MOVE/USDT daily chart has shown a persistent downtrend throughout 2025, characterized by lower highs and lower lows.
However, the price appears to be stabilizing within the $0.11 to $0.13 range, aligning with the 0.236 Fibonacci retracement level, a zone that could act as short-term support.
The $MOVE token approaches the upper boundary of a falling wedge pattern, a formation typically viewed as a bullish reversal pattern.
A confirmed breakout above this wedge, especially with a daily close above the 9-day SMA at $0.2307, could mark a potential trend reversal.
Should this breakout occur, Fibonacci extensions point to possible resistance levels at $0.2950, $0.4248, $0.5547, and $0.6349.
On the flip side, failure to hold above the support zone around $0.1185 or $0.0849 could result in further downside and continued investor pessimism.
