Ethereum USD Funding Rate Turns Negative as Bears Regain Control - Warning Signals Flash for ETH

Ethereum faces immediate bearish pressure as its perpetual futures funding rate plunges into negative territory, signaling a decisive shift where short sellers now dominate the market. The negative funding rate, a critical market sentiment gauge, coincides with a stark $210 million net outflow from Ethereum ETFs and growing institutional skepticism, setting the stage for potential volatility.
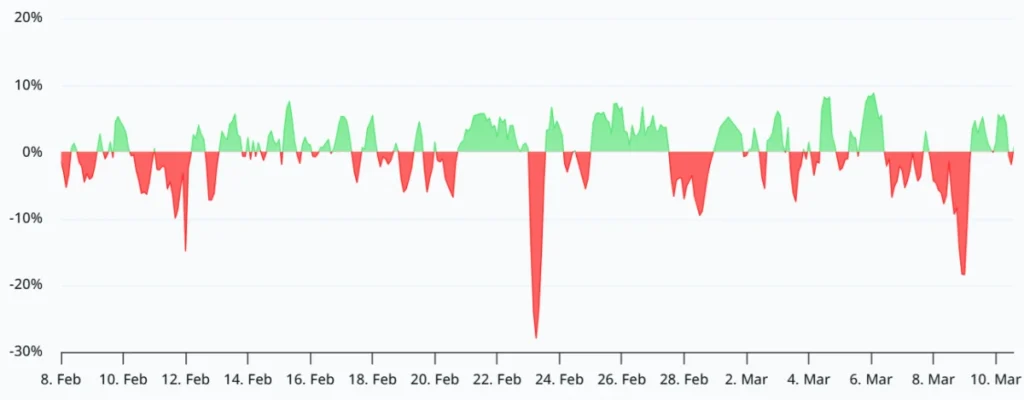 SOURCE: CoinGlass – ETH Funding Rate
ETH is currently struggling to hold the psychological $2,000 level, weighed down by a near -60% price correction over the last six months as it slid 1.9% overnight following a positive start to the week.
Traders view negative funding as a capitulation signal. Historically, prolonged negative rates have often preceded a squeeze, but the current macro setup suggests that legitimate spot selling pressure is driving the current price action.
What Negative Funding Rates Actually Signal for ETH
The flip to negative funding is more than just a momentary dip; it highlights a structural weakness in the market structure. When funding is negative, shorts pay longs, meaning the market is heavily skewed toward betting on lower prices.
CoinGlass data shows that while the aggregate funding rate is negative, the options market paints a slightly more nuanced picture.
The options risk gauge remains near the neutral -6% to +6% range, yet put options are trading at a 7% premium relative to calls.
This suggests that while futures traders are aggressively shorting, smart money is hedging against further downside rather than betting on a catastrophic collapse.
Additionally, as on-chain derivatives activity migrates to other networks such as Hyperliquid, demand for mainnet Ethereum protocols has softened, leaving price action dependent on speculative flows rather than utility.
The Levels That Change Everything for Ethereum USD
ETHEREUM IS BACK IN THE DISCOUNT ZONE.
Same level that launched the 2023 rally.
Same structure. Same cycle position.
$2K is the line.
Hold it: wave 3 begins.
Lose it: discount zone extends lower.
Last time $ETH was here, it 4x'd. pic.twitter.com/07XLcIuhSH
Technical structures define the next major move. Ether is currently testing a precarious zone. Bulls are attempting to defend the $2,000 support, but repeated tests suggest weakening buyer resolve.
If bears force a daily close below $1,980, the next major liquidity pocket sits at $1,840. A breakdown of that level leaves little structural support until $1,760, a zone that could trigger a cascade of long liquidations.
Conversely, for the bearish thesis to be invalidated, ETH needs to reclaim $2,120 on a high-volume breakout. A sustained move above this level would squeeze the aggressive late shorts currently paying funding.
This could potentially spark a rapid surge toward $2,300. However, until the $2,120 resistance is cleared, the path of least resistance remains lower.
What Traders Are Watching Next

The immediate trigger for a reversal lies in institutional flows. The -$210M ETF exit needs to stabilize; continued outflows will likely force the price through support regardless of derivatives positioning.
Traders are also monitoring the yield spread. With native ETH staking offering 2.8% versus stablecoin yields closer to 3.75% on platforms like Aave, capital efficiency currently favors stablecoins.
Unlike the broader market optimism, the data suggests ETH needs a specific catalyst, either a spike in spot buying or a capitulation wick to flush the remaining leverage, to reset the trend.
