Bitcoin Plunges to $66K Amid Oil Surge—Macro Storm Brews for Digital Gold

Bitcoin just hit $66,000—and the macro winds are turning ugly.
Oil’s breakout rally is tightening the screws on risk assets, sending traditional traders scrambling for cover. Suddenly, inflation fears are back on the menu, and the Fed’s next move looks murkier than ever.
Why Crypto’s Feeling the Squeeze
When crude spikes, everything flinches. Higher energy costs ripple through economies, pushing central bankers toward hawkish postures. That means tighter liquidity, stronger dollars, and less patience for speculative plays—including digital assets.
Bitcoin’s supposed to be an inflation hedge, right? Not today. In the short term, it’s trading like tech stock on steroids—sensitive to rate expectations and risk-off rotations. So when oil jumps, crypto often stumbles.
The $66K Signal
That drop to $66,000 isn’t just a number—it’s a test. Hold that level, and bulls can argue it’s a healthy pullback. Break below, and the narrative shifts toward deeper correction territory. All eyes are on institutional flows now: are the big buyers stepping in, or stepping back?
Meanwhile, in TradFi land…
Let’s be real—Wall Street still treats crypto like a side hustle. One whiff of macro trouble, and their “long-term conviction” vanishes faster than a meme coin’s liquidity. Funny how diversification only works until it doesn’t.
Bottom line: Bitcoin’s facing its first real macro stress test since the last cycle. Oil’s breakout is the unexpected antagonist, reminding everyone that digital gold still dances to old-world tunes when pressure mounts. Buckle up—volatility’s back on the menu.
Bitcoin and Stocks: Oil Prices are Recoupling Them
The correlation between Bitcoin and equities has tightened significantly, leaving the asset vulnerable to broader market panic.
The oil spike triggered immediate losses in Asia, where Japan’s Nikkei plunged 7% and South Korea’s KOSPI dropped 6% Monday. This risk-off shift has already impacted institutional flows. Bitcoin ETFs saw $576.6 million in net outflows late last week, adding sell-side pressure to the spot price.
When you were right about geopolitical instability but bought Bitcoin instead of gold or oil pic.twitter.com/7v2RTglhSZ
— Boring_Business (@BoringBiz_) March 1, 2026That heavy selling aligns with broader cross-asset weakness. As Bitcoin price and stocks stabilize, the bond market continues to signal ongoing macro risk, suggesting the path of least resistance remains lower for now.
If risk assets continue to sell off, Bitcoin’s high correlation suggests it will struggle to find a floor independent of the stock market.
Technical Price Analysis: The Levels That Change Everything
The technical picture shows Bitcoin testing critical support levels after losing the $70,000 handle. The price is currently hovering near $66,000.
The slide has brought Bitcoin back to levels seen before the recent surge.
If sellers push the price below $62,300, the chart structure risks a breakdown toward Fibonacci support levels at $56,800 or even $52,300.
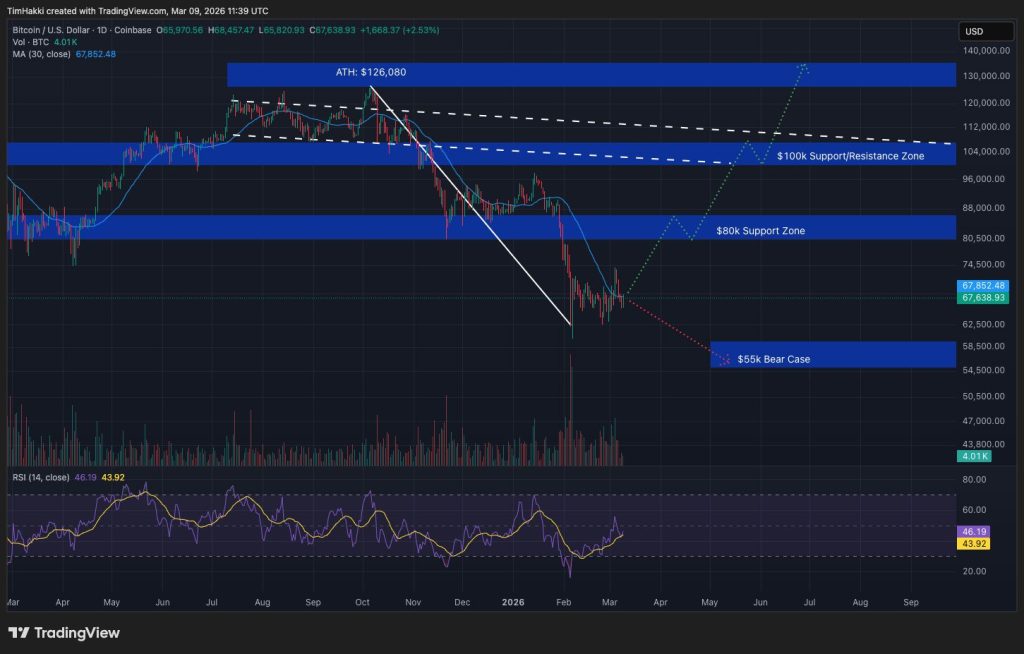
Bearish momentum is supported by the 50-day SMA at $77,200, which is currently acting as overhead resistance.
However, on-chain data offers a counter-narrative. Bitcoin is vanishing from exchanges, suggesting a potential supply shock could cushion the downside if long-term holders refuse to sell at these levels.
To invalidate the bearish structure, buyers need to reclaim the $72,600 level. Anything below that keeps the bears in control.
Bitcoin Fears: Rising Oil Prices Drive a Hawkish Fed
The surge in oil is the primary headwind. Crude prices rose 72% in the past month, sparking fears that input costs will drive inflation higher across industries.
Former President Donald Trump commented that the spike is a “very small price to pay,” but for markets, the cost is liquidity. If energy prices bleed into CPI data, the Fed may be forced to hold rates higher for longer.
That policy risk puts a cap on upside volatility. Traders monitoring options expiry and max pain levels should expect continued chop as the market prices in a more hawkish Fed.
Key Levels Summary
Resistance stands at $72,600. Bulls need to reclaim this level and the 50-day SMA to restart momentum.
The macro trigger remains crude oil at $110. Continued upside here exerts heavy pressure on risk assets and inflation expectations.
Support sits at $60,000 to $62,300. A loss of this zone opens the door to $52,000 as the next major demand area.
