Solana Price Prediction: SOL Targets $42 as Head-and-Shoulders Pattern Forms—Will the Neckline Hold?

Solana's chart just flashed a classic bearish signal—and it's pointing straight toward a $42 price target.
The Pattern That's Spooking Traders
A head-and-shoulders formation is completing on SOL's daily chart. That's technical analysis 101: a left shoulder, a higher head, a right shoulder, and a neckline support. Break that neckline, and the measured move projection lands right around $42. It's not a crystal ball, but it's the script the algos are reading.
Why This Technical Signal Matters Now
Markets run on narrative, and this pattern writes its own. It signals distribution—smart money slowly offloading to retail euphoria on the rallies. Each test of the neckline weakens it. The next sell-off could trigger a cascade of stop-losses, accelerating the drop toward the target. Forget the fundamentals for a second; this is pure crowd psychology playing out on the chart.
The Bull Case vs. The Chart
Sure, Solana's network is faster and cheaper than some legacy chains (looking at you, Ethereum). Developers are building. The ecosystem is growing. But price action has a nasty habit of ignoring the 'fundamentals' right when everyone's citing them. A break below $42 could see SOL hunting for liquidity much lower, turning every recent buyer into a bag-holder. It's the finance game—sometimes the chart just needs to humble the narrative.
So, will Solana defy the technicals and bounce, or will it follow the pattern's grim arithmetic down to double digits? The neckline is the line in the sand. Watch it like a hawk.
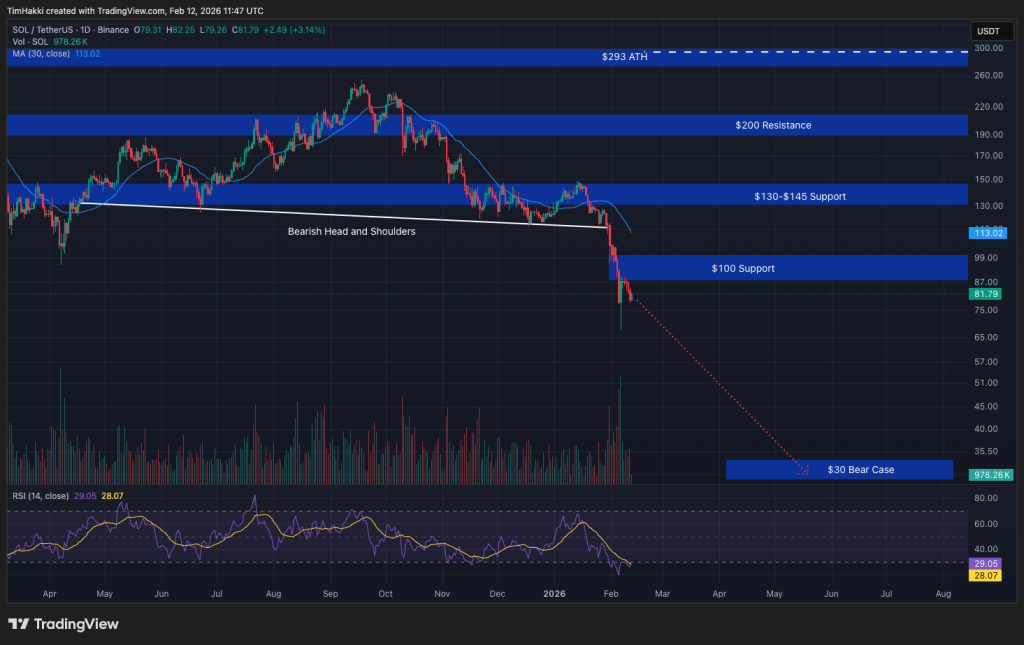 A bearish head and shoulders setup could be the sign of SOL’s collapse. Source: TradingView
Solana is currently stuck in a “make-or-break” juncture.
Sitting at approximately $82, the token has erased billions in market value, reflecting a staggering 72% loss from its ATH of $293 in January 2025. While typical market corrections are expected, this downward spiral has validated a classic head-and-shoulders bearish structure across its chart from April 2025 to February 2026.
For traders assessing the damage, whether SOL is one of the best cryptos to buy now might depend on whether key support levels can hold against this macro pressure.
Solana Price Prediction: Does the Head-and-Shoulders Pattern Indicate Imminent Collapse?
Is the bottom in, or is the pain just starting? The charts paint a grim picture.
Pseudonymous X crypto analyst “Shitpoastin” highlighted that a massive head-and-shoulders (H&S) pattern has formed on the monthly chart. This specific setup is notorious in technical analysis for signaling prolonged downturns.
Solana monthly looks fucking horrible lmao
Massive head and shoulders with nothing but air until $30… https://t.co/XiG9B6YxM5
![]()
![]()
Analyst Bitcoinsensus confirmed a breakdown from this macro structure, projecting a downside target as low as $50 per SOL.
#Solana has confirmed a breakdown from this macro Head & Shoulders pattern![]()
![]()
Target could be as low as 50$ per $SOL. pic.twitter.com/9Zqk2BML1b
Other market watchers are even more bearish. Analyst Alex Clay flagged an aggressive target of $42, a level that aligns with a long-watched demand zone from previous cycles. This represents a potential further downside of nearly 50% from current levels.
#SOL started to look bad![]()
It turned into a confirmed H&S and important support zone is lost!
H&S target fits the key level of 42$![]() See you there
See you there![]() #Solana $SOL pic.twitter.com/WuyMrKgjs9
#Solana $SOL pic.twitter.com/WuyMrKgjs9
However, it is not all doom and gloom. Solana’s MVRV extreme deviation bands suggest a potential floor at $75. Historically, SOL has staged rallies, like the 87% bounce in March 2022, after testing these lower boundaries.

What Traders Should Watch Next
If you are holding SOL, the $75 level is your line in the sand.
A decisive daily close below this support could trigger the secondary phase of the correction, mirroring the catastrophic drops seen during the 2022 crashes. This WOULD likely open the floodgates toward the $30 to $42 range mentioned by analysts.
Despite the price carnage, Solana’s network activity remains high, with fee revenue nearly doubling Ethereum’s recently.
Divergences between price and fundamentals often create opportunities to buy the best crypto, but only for traders who wait for confirmation.
Watch for a reclaim of $100 to invalidate the bearish thesis. Until then, the head-and-shoulders pattern dictates caution.
