Galaxy Analyst Sounds Alarm: Bitcoin’s Ownership Gap Threatens $63K Plunge

Hold on to your private keys—a major crypto research firm just flagged a critical vulnerability in Bitcoin's market structure.
The Warning Signal
Analysts are pointing to a growing chasm between different holder cohorts. It's not about retail versus whales this time—it's a deeper, structural divide in ownership concentration that's flashing red. When too few addresses control too much of the supply, the market loses its shock absorbers. Volatility doesn't just spike; it becomes a one-way street during sell-offs.
Why $63K Matters
The cited $63,000 level isn't a random number. It represents a critical confluence of technical support and realized price—the average price at which all current coins last moved. A break below that threshold could trigger automated sell orders and unwind months of bullish momentum. It's the line in the sand that separates a healthy correction from a trend reversal.
The Liquidity Crunch
Modern crypto markets run on liquidity. An ownership gap creates illiquidity pockets—zones where large sell orders meet minimal buy-side depth. The result? Price discovery gets ugly fast. Asset managers hate this more than a surprise regulatory crackdown—it turns orderly portfolios into fire sales.
Balancing the Bull Case
Let's be clear: this is a risk scenario, not a prophecy. Bitcoin's fundamentals—hash rate, institutional adoption, its hardening role as digital gold—remain intact. But even the strongest assets face technical headwinds. Smart money watches these signals, adjusts position sizing, and waits for the market to recalibrate. Sometimes the best trade is avoiding a crash you saw coming—a concept traditional finance still struggles with, preferring instead to sell 'diversified' funds that all own the same ten overvalued tech stocks.
The path forward requires monitoring on-chain flows like a hawk. When the ownership gap starts to close—when distribution becomes healthier—that's when the next leg up truly begins. Until then, consider it a reminder: in crypto, the most important gap isn't in the charts; it's between those who watch the fundamentals and those who just watch the price.
The $70K-$80K Ownership Gap Spells Trouble
According to Galaxy Research’s Bitcoin supply data based on when coins last moved onchain, a clear gap in ownership is visible in the $70,000-$80,000 range.
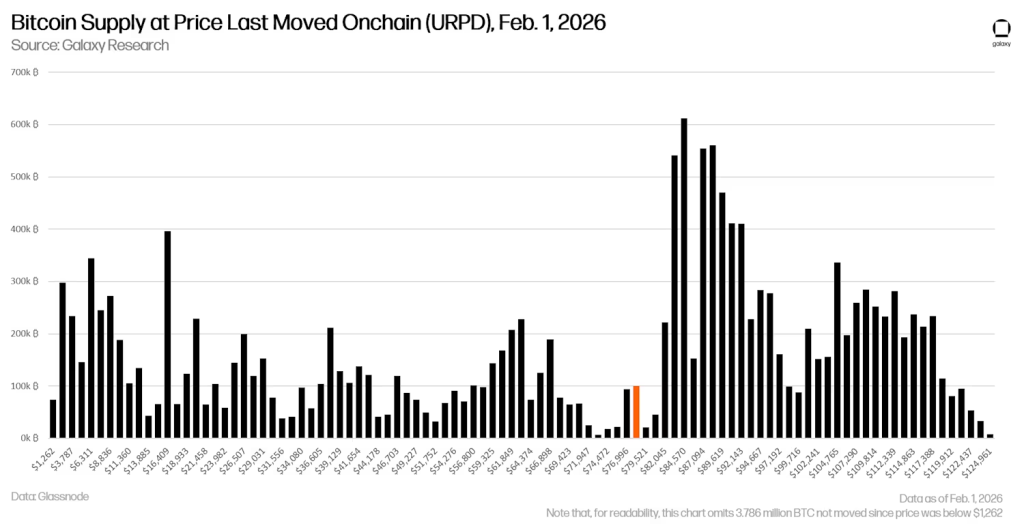
The vast majority of the approximately 194,000 BTC shown to have last traded betweenand did so just within the last two days, meaning these are shallow positions unlikely to hold under pressure.
Significant purchases have been made betweenover the last four months, but all other price cohorts have contributed to selling pressure.

“While it could see chop around the historic max discount-to-ETF-cost-basis of -10% (currently around $76k), for the reasons above, there is a significant chance that BTC drifts towards the bottom of the supply gap ($70k) and then potentially tests the realized price ($56k) and 200-week moving average ($58k) over the coming weeks and months,” Thorn explained.
Historical Patterns Signal Deeper Pain Ahead
With the exception of 2017, Bitcoin has never experienced a 40% drawdown from its all-time high that didn’t extend to 50% or more within three months.
A 50% drawdown from the current all-time high WOULD place BTC at exactly, the level Thorn flags as the next major pain point.
bitcoin now down -38% from all-time high
we’ve been predicting lower since october, called it a bear market in november
beimnet calling for eventual MOVE to 200w MA, currently $58k (gang), would likely be $60-$65k if it hits
galaxy brains
take notes![]() pic.twitter.com/HtlS2rkQ8u
pic.twitter.com/HtlS2rkQ8u
Data from Galaxy Research shows that across the last three bull markets in 2013/14, 2017/18, 2019, and 2021, the 50-week moving average served as key support.
However, when that level was lost, the price ultimately reverted to the 200-week moving average each time.
Bitcoin lost the 50-week moving average in November 2025, and the
The realized price, measuring the average cost basis for coins based on their last onchain movements, currently sits around, presenting another critical support zone to watch.
Gold Outperforms as Bitcoin Struggles With Narrative
Since the beginning of Q4 2025, Bitcoin has failed to keep pace with traditional safe-haven assets like gold and silver, a trend that has not gone unnoticed by financial commentators.
Investors have been fleeing toward commodities amid escalating trade tensions and growing concerns over the sustainability of global sovereign debt.
Bitcoin was widely expected to benefit from these conditions, given its decentralized nature and borderless utility.
Yet the leading cryptocurrency has moved in the opposite direction, surrendering ground to established hard assets and losing credibility among investors seeking refuge from macroeconomic turbulence.
Where Could BTC Bottom Hold?
Galaxy Research flagged at the tail end of last year that 2026 would likely prove too unpredictable to pin down a year-end price target for BTC.
Forty-five days into the year, that assessment has only proven more accurate.
Despite the bleak near-term outlook, the investment firm sees a potential opportunity emerging at lower levels.
Thorn noted that Bitcoin has historically found support around or slightly below the realized price before trading higher at past bear-market bottoms.
If price falls toward the 200-week moving average ator the realized price at, Galaxy Research believes these levels should present strong entry points for long-term investors, consistent with patterns seen in previous cycles.
