Bitcoin Price Prediction: The Exact Signal That Triggered a 370% Rally Is Flashing Again – Are You Ready?

The chart just blinked. A technical indicator that historically preceded a massive Bitcoin surge is back on the screen. Traders are leaning in.
The Signal Returns
It's the same pattern. The same convergence of moving averages and momentum oscillators that, in the past, lit the fuse for a near-quadruple-digit percentage climb. Market veterans recognize the setup instantly—it's not a subtle hint, it's a klaxon.
Mechanics of a Move
This isn't astrology. The signal forms when prolonged consolidation meets a decisive shift in on-chain accumulation. Large wallets move, network activity spikes, and the price chart finally breaks its cage. It bypasses minor resistance levels and cuts through bearish sentiment. The last time this alignment happened, it wasn't a 50% gain—it was a 370% march toward new highs.
Market Psychology at the Edge
Fear-of-missing-out is a more powerful driver than any white paper. When a proven catalyst reappears, hesitation evaporates. The crowd watches for the first major green candle to confirm the breakout, knowing the early move is often the most profitable. It separates the holders from the spectators.
Are You Positioned?
History doesn't repeat, but it often rhymes—usually while Wall Street analysts are busy downgrading the asset they called 'digital gold' six months prior. The signal is live. The market's memory is surprisingly short, but the charts remember everything. The next leg up might already be in its early, quiet phase. Your move.
Bitcoin Price Prediction: Wedge Breakout Signals BTC Rally Toward $99K Amid EMA Cross and RSI Divergence
Beyond on‑chain signals, Bitcoin price prediction seems bullish as BTC continues to respect an ascending trendline from $86,700, forming a wedge pattern between $91,885 support and $95,483 resistance.
The convergence of the 50‑period and 200‑period EMAs suggests a potential golden cross, a historically bullish event. Meanwhile, the RSI sits NEAR 47, showing a subtle bullish divergence against recent price dips. Candlestick formations, including spinning tops and Doji patterns, highlight indecision but also hint at accumulation.
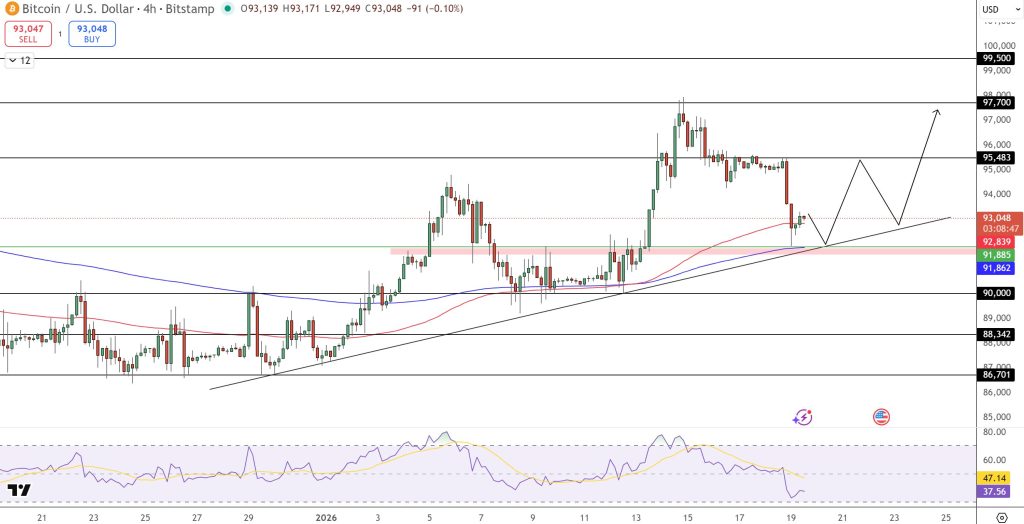
A breakout above $95,500 with strong volume could propel BTC toward $97,700 and $99,500, completing the wedge’s projected path. Conversely, a breakdown below $91,885 risks a retest of $90,000 and the psychological $88,342 level.
What Traders Should Watch Next
The alignment of on‑chain and technical signals makes this moment critical for traders. The Kimchi Premium’s rise suggests demand pressure is building, while chart patterns point toward a breakout.
For traders, the setup is clear:
- Entry: Long positions above $95,500 on confirmed breakout
- Targets: $97,700 and $99,500
- Stop‑loss: Below $91,800 to manage risk
If history repeats, Bitcoin could be on track for another multi‑hundred‑percent rally, echoing the October 2023 surge. While macroeconomic conditions and institutional flows will influence the scale of the move, the signals flashing today are difficult to ignore.
Bitcoin Hyper: The Next Evolution of BTC on Solana?
Bitcoin Hyper ($HYPER) is bringing a new phase to the Bitcoin ecosystem. While BTC remains the gold standard for security, Bitcoin Hyper adds what it always lacked: Solana-level speed. The result: lightning-fast, low-cost smart contracts, decentralized apps, and even meme coin creation, all secured by Bitcoin.
Audited by Consult, the project emphasizes trust and scalability as adoption builds. And momentum is already strong. The presale has surpassed $30.7 million, with tokens priced at just $0.013585 before the next increase.

As Bitcoin activity climbs and demand for efficient BTC-based apps rises, Bitcoin Hyper stands out as the bridge uniting two of crypto’s biggest ecosystems. If Bitcoin built the foundation, Bitcoin Hyper could make it fast, flexible, and fun again.
Click Here to Participate in the Presale
