Bitcoin’s Paradox: Navigating a ’Structurally Fragile Range’ – Weak on Paper, Solid in Practice

Bitcoin's price action is telling a contradictory story—trading inside what analysts call a 'structurally fragile range' yet displaying surprising underlying resilience. The digital asset isn't crashing through support; it's stress-testing it.
The Anatomy of Fragility
Think of this range not as a calm harbor, but as a narrow ledge. Every test of the lower boundary sends minor tremors through the market. Liquidity here is thin—a big move in either direction could trigger a cascade of stop-losses or a short squeeze. It's the kind of setup that keeps leveraged traders awake at night, checking charts by phone-light.
Strength in the Weakness
Here's the twist: the very fact Bitcoin hasn't collapsed is the bullish signal. Each bounce off support, however tentative, adds another layer of validation. On-chain data shows long-term holders aren't flinching—they're accumulating, treating volatility like a discount. The network's hash rate, that ultimate measure of security, continues its relentless climb upward, completely indifferent to the price anxiety.
The Waiting Game
The market is coiled, waiting for a catalyst. It could be a macro shift, a regulatory nod, or simply a whale deciding the accumulation phase is over. Until then, Bitcoin does what it does best: absorbs sell pressure, frustrates both permabulls and permabears, and demonstrates that its core value proposition—digital scarcity—remains untouched by short-term chart patterns. After all, in traditional finance, 'fragility' usually precedes a bailout announcement. In crypto, it just precedes the next leg up.
Moreover, looking at the onchain indicators, the analysts found that, as the market sits in this weak but bounded range, “time becomes a negative force.” They explain that investors find it more difficult to endure unrealized losses. Simultaneously, the possibility of loss realization increases.
Subsequently, as realized losses rise, recovery anchors further. A surge in realized profit from veteran investors boost this effect.
That said, the price did slightly recover above the True Market Mean. In the short term, if seller exhaustion arises, this underlying buy pressure could result in a retest of the $95,000 level and potentially the STH-Cost Basis at $102,700.
“Until then, the True Market Mean remains the most probable bottom-formation zone, barring a new macro shock,” the analysts write.
You may also like: Bitcoin is ‘Stuck in Consolidation Limbo’, Not Ready For a Bullish Reversal, Says Glassnode Bitcoin (BTC) is consolidating within a mild bearish phase, trading between $97,000 and $111,900. The resistance stands near $116,000 “marked by top-buyers’ supply cluster,” according to the latest report by the blockchain data provider Glassnode. Notably, significant factors like ETF outflows, low leverage, and persistent put demand portray a highly cautious market that’s currently waiting for “renewed conviction.” Market in a State of Consolidation Bitcoin has dipped below $100,000...Transition Into Low-Liquidity, Mean-Reverting Environment
Onchain factors show a cautious tone, and off-chain conditions echo it, Glassnode says.
In short, exchange-traded funds (ETF) flows are negative, spot liquidity is subdued, and futures markets lack speculative engagement.
The spot market is seeing a thinner demand buffer. This lowers immediate buy-side support, with the price standing in a place “more vulnerable to macro catalysts and volatility shocks.”
Moreover, Bitcoin’s spot relative volume sits NEAR the lower bound of its 30-day range. It suggests “a more defensive positioning across the board.” Fewer liquidity-driven flows are available to absorb volatility or sustain directional moves.
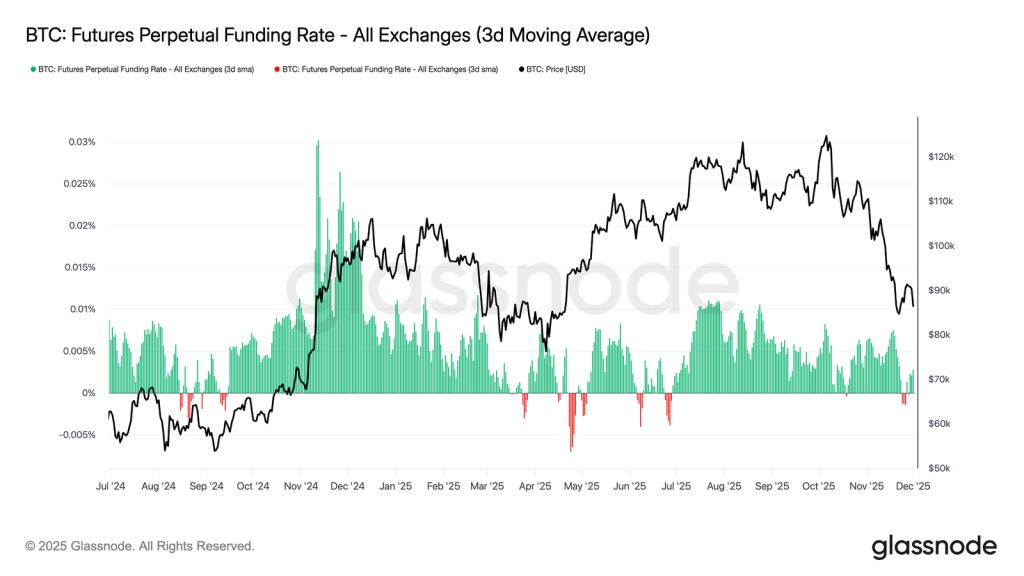
Additionally, “across perpetual markets, funding hovered around zero to slightly negative during the week, underscoring the continued retreat in speculative long positioning,” the report says.
Meanwhile, the options market recorded “muted” action, in contrast with a jump in short-dated implied volatility. This comes as traders position for a larger move.
“Options markets reinforce a defensive posture, with traders accumulating volatility, bidding short-dated downside protection, and positioning for a near-term volatility event,” the analysts says.
Additionally, they found that traders are buying and not selling volatility. Also, traders buying both wings suggest hedging and convexity-seeking behaviour instead sentiment-driven speculation.
“Combined with rising implied volatility and a downside-leaning skew, the FLOW profile suggests that market participants are preparing for a volatility event with a bias toward the downside,” Glassnode says.
Notably, the USmeeting on 10 December was the last meaningful catalyst, so the market is preparing for a transition into a low-liquidity, mean-reverting environment.
After the rate cut announcement, gamma sellers typically re-enter, accelerating IV decay into year-end. “Absent a hawkish surprise or a notable shift in guidance, the path of least resistance points toward lower implied volatility and a flatter surface through late December,” the report concludes.
You may also like: Why Is Crypto Down Today? – December 11, 2025 The crypto market is down today, with the cryptocurrency market capitalisation decreasing by 2.8% and pulling back to $3.16 trillion. 97 of the top 100 coins have gone down over the past 24 hours. At the same time, the total crypto trading volume is at $154 billion. Crypto Winners & Losers At the time of writing, all top 10 coins per market capitalization have seen their prices decrease over the past 24 hours. Bitcoin (BTC) is down by 2.8% since this time yesterday, currently...