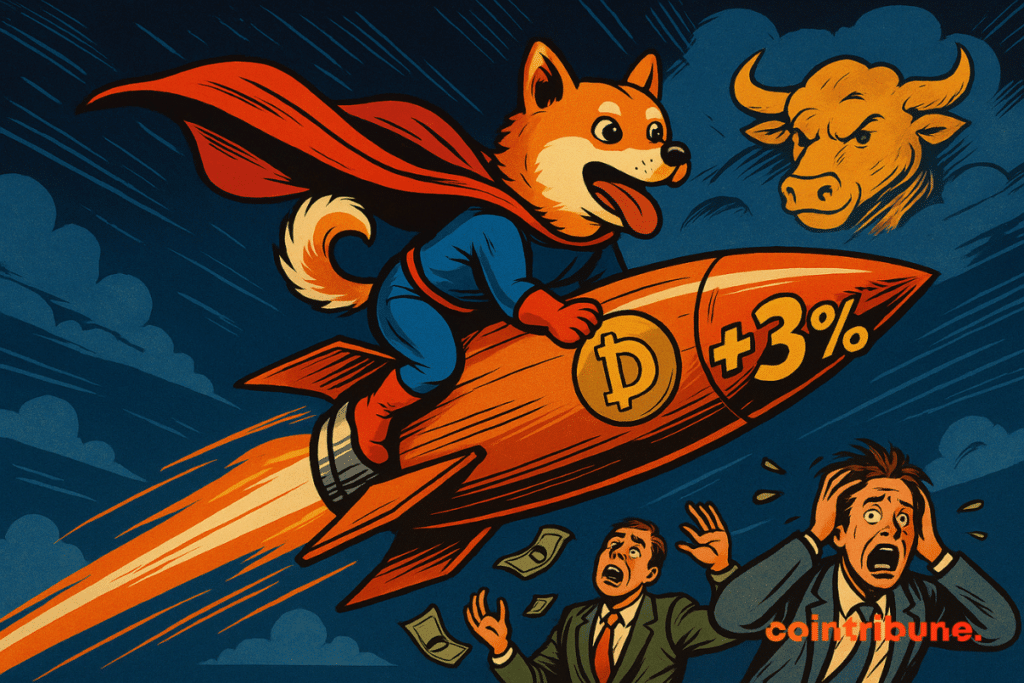
Dogecoin Rips Higher—Short Sellers Get Wrecked in Liquidation Bloodbath
Meme coin goes full berserk mode as leveraged bears get steamrolled.
### The squeeze is real—and painful
DOGE’s sudden 30% pump turned into a short-seller slaughterhouse. Overleveraged positions got liquidated faster than a crypto bro’s inheritance during an ICO frenzy.
### Market mechanics meet memetic madness
The rally triggered cascading buy orders—proof that even joke assets play by Wall Street’s brutal rules when liquidity dries up. Just don’t tell the ’HODL’ crowd this looks suspiciously like traditional finance wearing a dog mask.
Another reminder: in crypto, you’re either the hammer or the nail. Today, Dogecoin swung hard.

In Brief
- Dogecoin rose over 3% in 24 hours, triggering significant short liquidations.
- Short positions saw $5.24 million in liquidations, compared to $2.80 million for longs.
- Technical indicators like MACD and RSI point to building bullish momentum.
Dogecoin Climbs, Short Sellers Caught Off Guard
As the Doge price edged higher, many short traders were forced to close their positions, leading to a wave of liquidations. The shift ended up causing a 200% liquidation imbalance in the market, mainly affecting those holding short positions on Dogecoin.
According to data from CoinGlass, short trades saw $5.24 million in liquidations across the 24-hour period, while long positions recorded a smaller $2.80 million. The gap shows how the sudden price rebound left many short sellers exposed, unable to react quickly enough.
Within just one hour, short traders lost $741,090, compared to only $18.62 on the long side. Over a four-hour window, short positions faced $19.54K in liquidations, while long positions were at $410.06K. Even looking at the one-hour chart, short trades lost $19.13K, and long trades just $2.59K. Across all timeframes, shorts consistently took heavier losses.
Signs of Strength in the Charts
Looking at the current technical indicators, Dogecoin shows early signs of upward momentum. The MACD line is at 0.01338, just below the signal line, which sits at 0.01360. The histogram is at -0.00021, suggesting that the lines are beginning to converge. If they cross, it would reflect a potential shift in momentum towards buyers.
The RSI is also offering useful insight. It currently sits at 59.79, which is well below the overbought level of 70. This means there’s still room for the price to MOVE higher without being considered overextended. In addition, the RSI has been forming higher lows, which can be a sign of building strength among buyers.
DOGEUSD chart by TradingViewAnalysts Watch for Key Levels
With the recent bounce in price and liquidations piling up on the short side, some market analysts have started outlining possible next steps for Dogecoin.
Top crypto commentator Ali Martinez noted that if the coin can manage a clean break above $0.239, it could open the way for a move toward $0.265. This level is being watched closely, as clearing it might encourage further buying and shift market sentiment more firmly in favor of bulls.
Another analyst, World Of Charts, observed that dogecoin may have formed a bullish flag pattern. This type of setup usually appears after a short-term rally and could signal a continuation if the price breaks above the upper boundary of the flag. If that happens, the next price target being mentioned is around $0.30.
Similarly, Javon Marks linked Dogecoin’s past bull market cycles to its current setup. He noted that, based on how the memecoin behaved in the past, it could increase by at least 215% to reach $0.73905.
While these views do not guarantee results, they reflect how the mood around Dogecoin is beginning to shift. The recent increase in active addresses, coupled with lighter liquidation on long trades and increasing pressure on shorts, adds some weight to the possibility of further upward movement.
Maximize your Cointribune experience with our "Read to Earn" program! For every article you read, earn points and access exclusive rewards. Sign up now and start earning benefits.

