Bitcoin’s Bull Run Holds Strong—But Traders Are Watching Every Tick

Bitcoin refuses to back down—another week, another bullish flag waving in the crypto trenches. Here’s what the charts scream as of May 13, 2025.
Key Levels to Watch
The king of crypto keeps teasing new highs, but institutional traders are lurking like vultures at a picnic. Resistance levels? More like suggestions at this point.
Why This Rally Feels Different
Retail FOMO meets hedge fund hedging—liquidity’s pouring in from both sides. Even the SEC’s usual gloom can’t kill the mood (though they’ll keep trying, because bureaucracy never sleeps).
The Cynic’s Corner
Wall Street still can’t decide if Bitcoin’s digital gold or a high-risk casino chip. Meanwhile, the rest of us stack sats and laugh all the way to the actual bank.

In Brief
- Technical analysis: Bitcoin is trading around $105,230, in an uptrend despite a decline in volumes (−4.6%) and a retreat in momentum.
- Key levels: Bullish bias above $105,700, resistances at $107,000 and $109,354, supports down to $93,436.
- Market sentiment: Euphoria driven by BTC spot ETFs, signaling strong risk appetite.
- Derivatives market: Open interest rising, balanced flows, positive funding rate — a moderate bullish bias.
- Forecasts: Target at $109,354 (+4%). In case of a breakout, possible retracement to $93,426 or even $84,000 (−20%), depending on the macro context.
BTC/USD Technical Analysis
| Spot Price | $105,230 | Sustained rise with a key resistance breakout. |
| Latest Weekly Changes | +1.7% | Moderate recovery after a consolidation phase. |
| Latest Weekly Volumes | 31.3B (−4.6%) | Slight decrease in activity, reflecting a slowdown in interest. |
| Long-Term Trend (SMA 200) | Bullish | Strongly upward trend, confirming positive underlying momentum. |
| Mid-Term Trend (SMA 50) | Bullish | Clear acceleration of mid-term bullish momentum. |
| Short-Term Trend (SMA 20) | Bullish | Sustained upward phase, despite a slight recent fatigue. |
| Momentum | Decline | Pullback from overbought zone, indicating weakening momentum. |
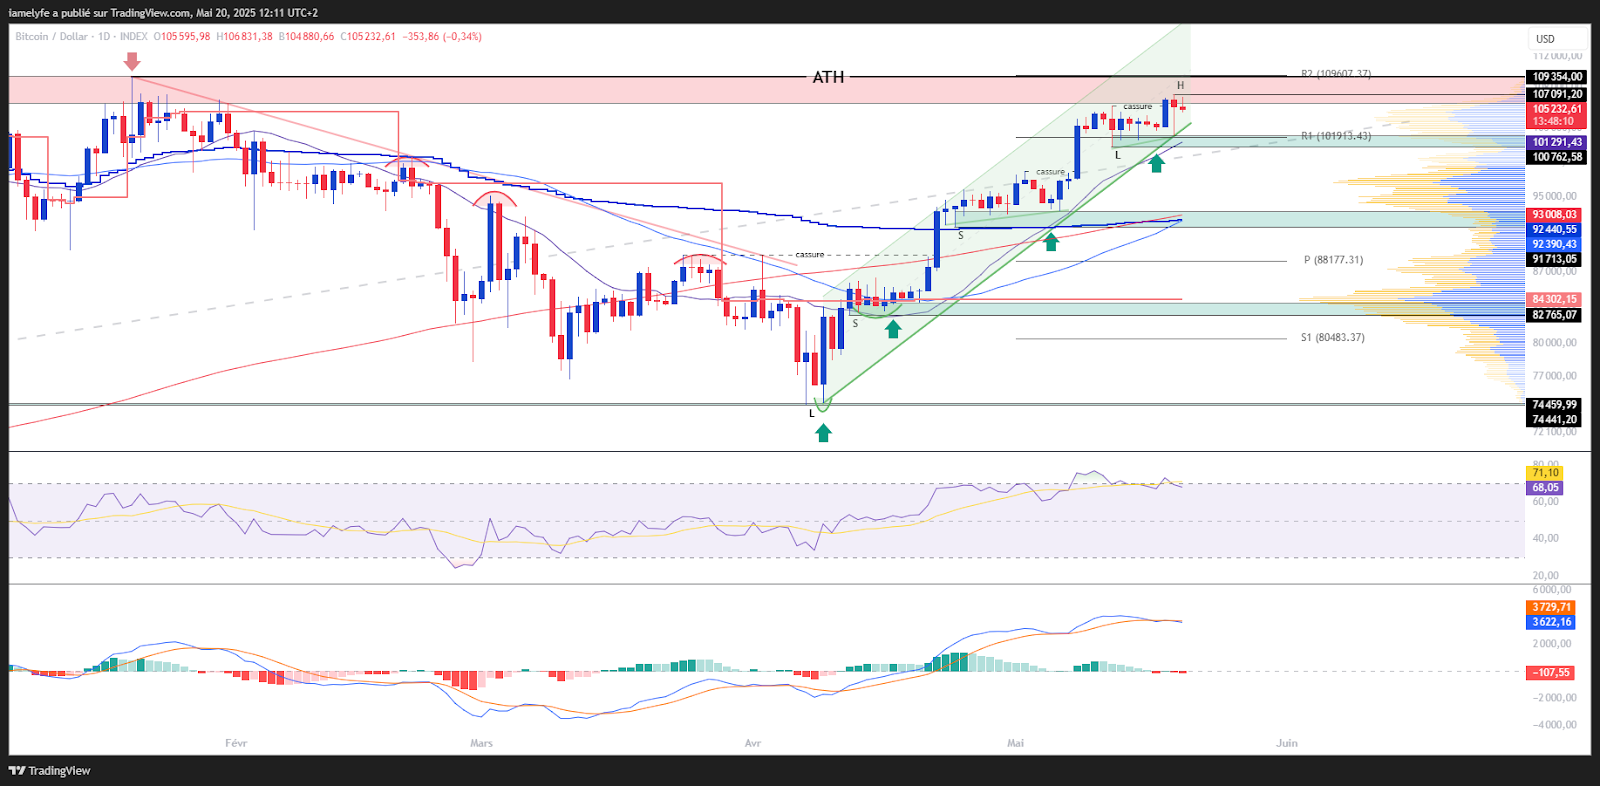
Bitcoin is trading around $105,230, supported by sustained gains and a key technical breakout. Over the week, the market is up +1.7%, marking a moderate recovery after consolidation. Weekly volumes reached $31.3 billion, down 4.6%, signaling a slight retreat in activity. Trends remain bullish across all timeframes: short (SMA 20), mid (SMA 50), and long term (SMA 200), reflecting solid momentum. Momentum is down from an overbought zone, suggesting a possible short-term slowdown.
Bitcoin Technical Levels (BTC)
| Resistances | $107,000 – $107,300 / $109,354 (ATH) | Critical zones, potential distribution thresholds. |
| Support | $102,100 – $100,700 / $93,436 | Major defense levels, likely accumulation zones. |
| Last Daily Breakout | $105,700 | Resistance breached, bullish bias continues. |
| Monthly Pivot Point | $88,177 | Reference level for the monthly trend below price. |
| High Value Area | $105,600 | High volume zone; upper boundary of market balance, beyond which imbalance may occur. |
| Low Value Area | $84,150 | High volume zone; lower boundary of market balance, beyond which imbalance may occur. |
Bitcoin faces significant resistance between $107,000 and $107,300, with an all-time high at $109,354 — zones likely to trigger profit taking. Major supports lie between $102,100 and $100,700, then around $93,436, representing potential accumulation levels. The last daily breakout at $105,700 confirms a bullish bias. The monthly pivot at $88,177 remains a key reference, well below the current price. Finally, value areas at $105,600 (high) and $84,150 (low) define the bounds of a market equilibrium, a break of which could signal imbalance.
Market Sentiment
| Market Sentiment (Fear & Greed Index) | Greed | Euphoric sentiment confirming the return of risk appetite. |
| BTC Spot ETF Flows (net flows) | Significant inflows | Institutional flows support the current trend. |
The market is in a greed zone, reflecting euphoric sentiment and a clear resurgence in risk appetite. BTC spot ETFs record significant inflows, indicating strong institutional support for the current bullish momentum.
The current technical analysis was conducted in collaboration with Elyfe, and 0xhugzer, investors and popularizers in the cryptocurrency market.
Derivatives Analysis (BTC/USDT)
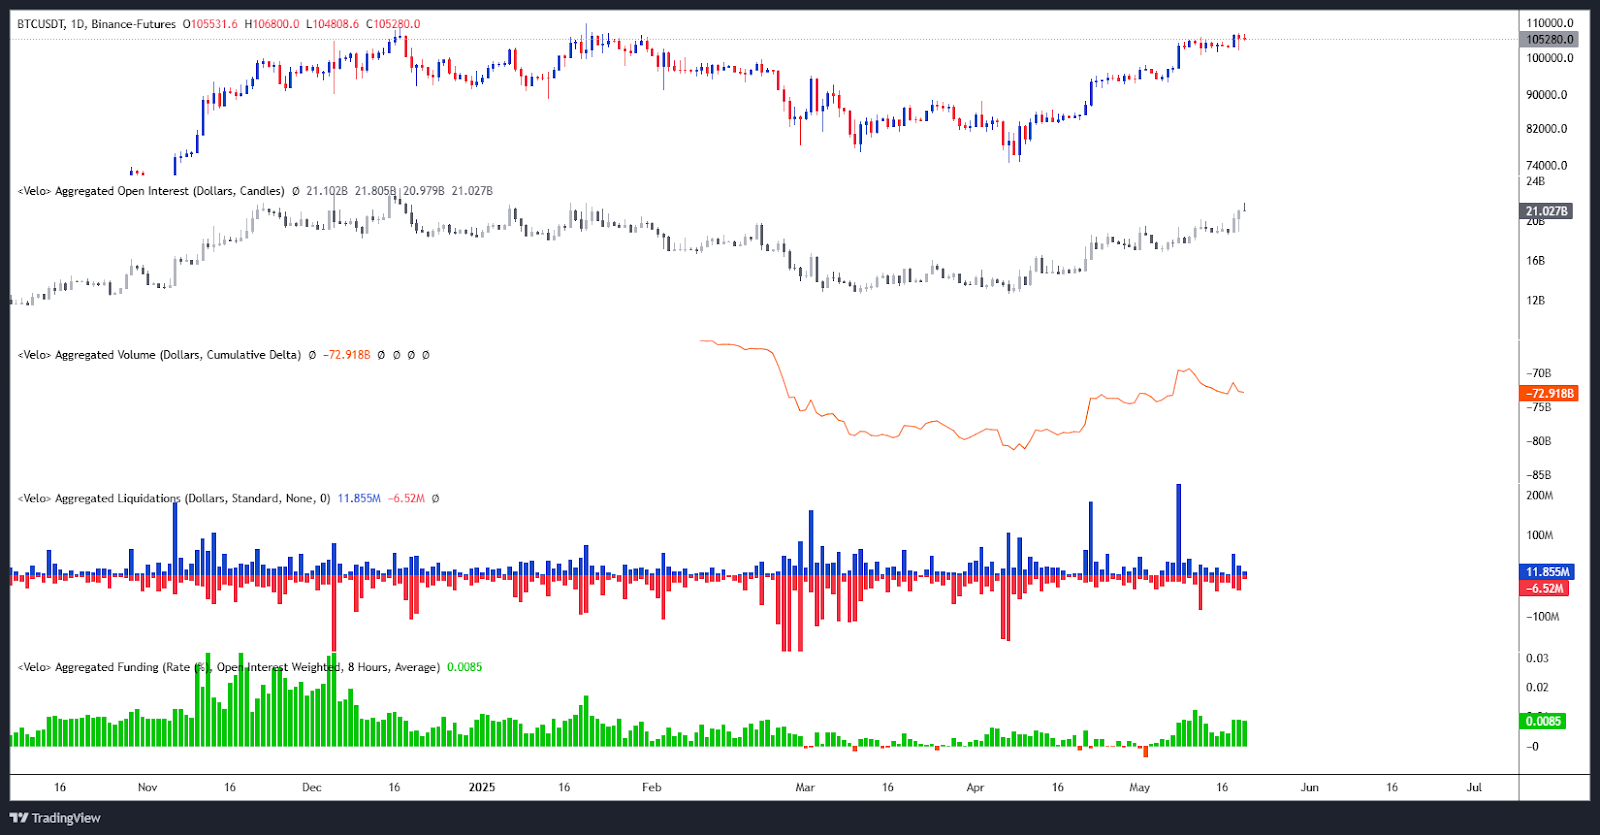
| Open Interest | Rising | Increasing speculative positioning and interest. |
| CVD | Balanced flows | Relatively stable flows, with no marked imbalance. |
| Liquidation | Low, unbiased | Moderate and balanced liquidation activity, no notable directional pressure. |
| Funding Rate | Slightly positive | Mild bullish bias, moderate premium for long positions. |
Indicators suggest a market building up, highlighted by rising open interest reflecting growing speculative interest. The CVD shows balanced flows, with no clear dominance between buyers and sellers, while liquidation levels remain low and unbiased, indicating no forced pressure either way. Finally, a slightly positive funding rate reveals a small advantage on the buyer side without signs of overheating or excessive optimism.
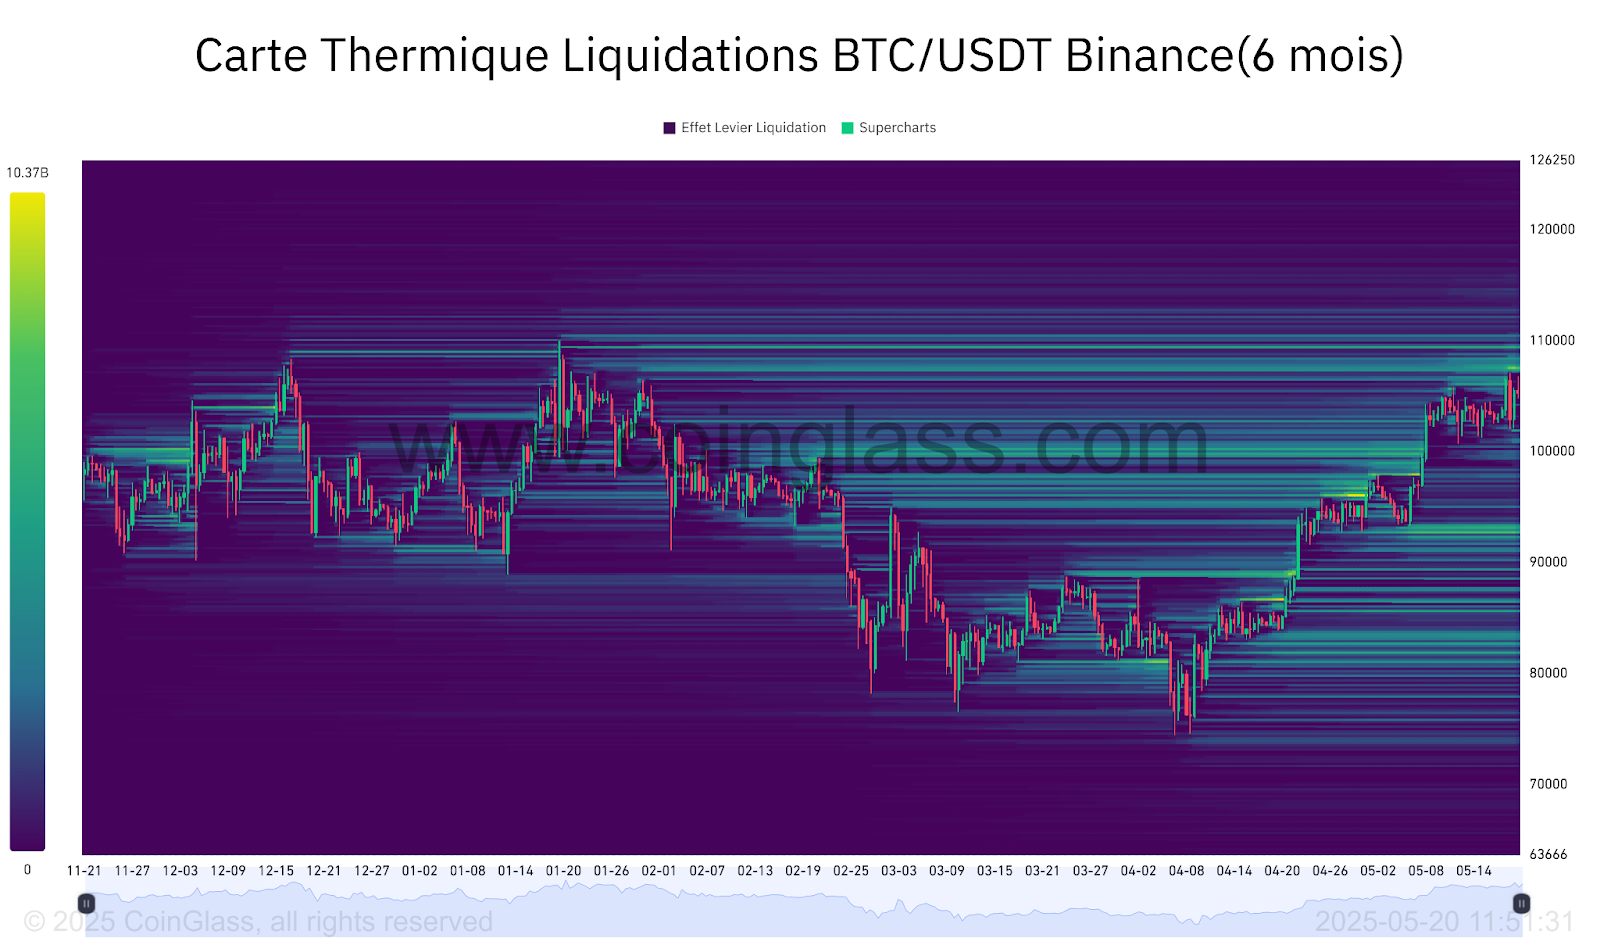
| Seller Liquidation Zone | ≈ $107,400 – $109,500 | Sensitive areas in case of breakout, risk of movement amplification. |
| Buyer Liquidation Zone | ≈ $93,400 – $92,400 / $83,700 – $81,000 | Critical downside thresholds, potential flush zones. |
Bitcoin is framed by two key liquidation zones. On the upside, the zone between $107,400 and $109,500 represents a concentration of seller liquidations that could amplify a breakout if triggered. On the downside, critical thresholds between $93,400 and $92,400, and lower between $83,700 and $81,000, mark vulnerable areas where a buyer capitulation MOVE could be triggered if bearish pressure intensifies.
Bitcoin Price Forecasts (BTC)
Bullish Scenario:
- Conditions: Hold above $10,762.
- Targets: $107,091 / $109,354 (ATH).
- Potential: about +4% gain from current level.
Bearish Scenario:
- Conditions: Break of support at $10,762.
- Targets: $93,426 / $91,713 / $84,000.
- Potential: approximately −20% decline from current level.
Comment:
The bias remains bullish, but U.S. macroeconomic indicators and news related to the global geopolitical context will be decisive to confirm this scenario.
BTCUSD chart by TradingViewConclusion
Bitcoin shows an overall bullish momentum, supported by a solid technical trend and a marked return of risk appetite. Sentiment is favorable, reinforced by growing institutional investor interest. However, some signs of short-term slowdown call for caution. The trend remains positive, but its confirmation will largely depend on the evolution of macroeconomic and geopolitical contexts. In this environment, it will be essential to closely monitor price reactions at strategic levels to confirm or adjust current forecasts.
Finally, let us remind you that these analyses are based solely on technical criteria, and cryptocurrency prices can rapidly change depending on other more fundamental factors.
Did you find this study interesting? Read our latest ONDO analysis.
Maximize your Cointribune experience with our "Read to Earn" program! For every article you read, earn points and access exclusive rewards. Sign up now and start earning benefits.

Log in to Reply
Log in to comment your thoughtsComments
Related Articles
|Square
Get the BTCC app to start your crypto journey
Get started today Scan to join our 100M+ users