BTC Stumbles Below $96K as US Traders Dump Holdings—Just Another Day in Crypto Volatility

Bitcoin’s bull run hits a speed bump as American sellers trigger a 5% dip—because nothing says ’stable store of value’ like double-digit swings before breakfast.
Wall Street’s latest ’risk-off’ tantrum spills into crypto markets, proving once again that traditional finance and digital assets remain locked in their dysfunctional love-hate relationship.
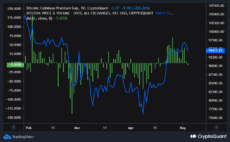
Coinbase premium gap | Source: CryptoQuant
If the Coinbase Premium remains in negative territory, short-term downside risk could escalate, especially amid growing miner outflows.
BTC Price Outlook
At the time of writing, Bitcoin is consolidating around $94,400 after a brief rally to $97,600 last week. On the daily BTC price chart, the RSI stands at 60, suggesting the largest cryptocurrency remains in bullish territory but is losing momentum.
A further drop in RSI could shift the sentiment to bearish. Immediate support lies near, while. A decisive break below $92,000 support could send BTC further downwards in the short-term.
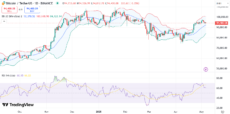
BTC price chart with Bollinger bands and RSI | Source: TradingView
Bollinger Bands are tightening slightly after a recent expansion, with the price approaching the upper band. The cryptocurrency could face resistance around $96,800 and traders could see a pullback toward the middle band (20-day SMA) NEAR $92,370.
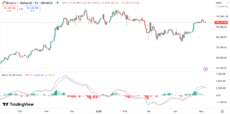
BTC price chart with MACD | Source: TradingView
Meanwhile, the MACD histogram is beginning to fade, with a possible bearish crossover in the near term.
nextBitcoin (BTC) Price Slips Below $96K as Selling Pressure Mounts from US

Log in to Reply
Log in to comment your thoughtsComments
Related Articles
|Square
Get the BTCC app to start your crypto journey
Get started today Scan to join our 100M+ users