BONK Smashes Bearish Streak with 60% Weekly Rally—Teases ‘Fun Stuff’ Ahead

Memecoin BONK just flipped the script—breaking a grueling multi-month downtrend with a blistering 60% surge this week. The Solana-based token’s rebound comes with cryptic promises of ‘fun stuff’ brewing—because nothing says serious finance like dog-themed tokens and vague hype.
Traders are watching to see if this pumpshot turns into sustained momentum or just another dead-cat bounce. Meanwhile, Wall Street still can’t decide whether to scoff or secretly ape in.
Technical Breakout and Fib Levels
BONK broke out of a multi-month descending parallel channel on April 13, flipping both the 50-day and 100-day exponential moving averages into support.
According to CoinMarkerCap data, BONK is hovering NEAR $0.00001934 after reaching an intraday high of $0.00002167 on April 28, a 73% increase from its local low of $0.00001247 on April 22.
The recent rally pushed BONK above the key 1.618 Fibonacci level at $0.00001990. If bulls maintain control and volume continues to rise, the next upside targets lie at the 2.618 Fib ($0.00002517), followed by the 3.618 level at $0.00003044.
The final major Fib extension, 4.236 at $0.00003369, may act as a magnet if hype around the Solana event intensifies. However, failure to hold the 1.618 level could prompt a short-term retracement toward $0.00001700.
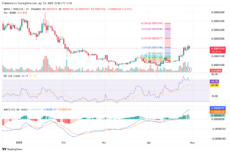
BONK Daily Chart | Source: TradingView
On the other hand, the Relative Strength Index (RSI) on the daily timeframe has surged to 66.78, just shy of the overbought threshold, signaling strong bullish momentum but also cautioning that a cooldown could occur.
Historically, BONK has seen short consolidations near the 70 RSI level before continuing upward, suggesting a temporary pullback might precede further gains.
Meanwhile, the MACD line remains comfortably above the signal line, with widening histogram bars confirming a healthy upward trend. Momentum remains firmly in the hands of buyers.
Analysts Turn Bullish: $0.000040 in Sight?
Crypto analyst World of Charts noted BONK’s breakout from the descending trendline, predicting a possible 2x in the coming days.
$Bonk #Bonk Descending Trendline Got Cleared, Expecting 2x In Coming Days. pic.twitter.com/mZhoGbZ3bB
— World Of Charts (@WorldOfCharts1) April 27, 2025
Meanwhile, Crypto Joe highlighted a bullish pennant formation in the lower timeframes, targeting a near-term move to $0.00002690, which aligns closely with the 2.618 Fib level.
#Bonk has a Double Bottom and Bullish Pennant chart pattern on the 30m chart.
Overall: Bullish.
Price Target: $0.00002690.#BONK $BONK #Crypto #Altcoins #AltcoinSeason #BONKUSDT#MemeCoin #MemeCoins #Altseason pic.twitter.com/mOZnTIwhNU
— Crypto Joe (@CryptoJoeReal) April 28, 2025
A clean daily close above the 200-day simple moving average at $0.00002410 could unlock a path toward January’s high near $0.000040.
Such a move would represent a 104% rally from current levels and put BONK back on the radar of top-performing altcoins in Q2 2025.
nextBONK Breaks Multi-Month Downtrend with 60% Weekly Surge, Promises ‘Fun Stuff’
