Ethereum Outlook: Tron Founder Justin Sun Maintains Bullish Stance as Whales Accumulate ETH

Amid growing market speculation, Tron founder Justin Sun has reaffirmed his bullish stance on Ethereum (ETH), coinciding with significant accumulation by large-scale investors. As of April 2025, on-chain data reveals heightened whale activity, suggesting institutional confidence in ETH’s long-term value proposition. Sun’s public endorsement aligns with broader industry sentiment as Ethereum continues to demonstrate network resilience and adoption growth despite macroeconomic headwinds. Market analysts highlight that this accumulation phase may signal anticipation of upcoming protocol upgrades or institutional portfolio rebalancing in the digital asset space.
Ethereum Faces Challenges
While Sun doubles down, the Ethereum network itself is facing a set of challenges. Daily active address metrics remain volatile, with data showing a year-over-year decline of over 11%, down to roughly 450,000 active addresses as of mid-April.
Ethereum’s (ETH) daily active addresses present a mixed picture, introducing uncertainty. While YCharts data showed a year-over-year decline of over 11% to ~450,565 by mid-April 2025, other recent reports noted temporary surges, sometimes exceeding 1 million addresses. This…
— David Gross davidgrossapps (@dgapps) April 17, 2025
Though temporary spikes have occurred, occasionally breaching the one-million mark, the broader picture suggests a fading momentum in consistent user interaction.
Another key indicator of the current Ethereum slowdown is the plunge in gas fees, now at their lowest since 2020. According to Santiment, average transaction fees have dropped to just $0.168, a clear reflection of reduced network demand.
🚨💸 BREAKING: Ethereum fees are at a 5-year low, with transactions currently costing just $0.168. This is the cheapest daily cost of making $ETH transfers since May 2, 2020. We briefly break this down in our latest insight. 👇https://t.co/fg5CfRgsHn pic.twitter.com/QlLwyzdm1F
— Santiment (@santimentfeed) April 16, 2025
ETH Price Analysis
The daily Ethereum chart below shows a downtrend that began in mid-December 2024 and has persisted into April 2025. Also, a potential descending wedge pattern has been forming since around mid-February 2025.
This pattern, characterized by converging lower highs and lower lows, is generally considered a bearish continuation pattern. The more likely future would be ETH breaking down below the lower trendline of the wedge.
Technically, if a breakdown occurs around the current price level of $1575, a potential target could be in the range of $975 ($157-$600).
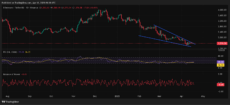
Ethereum Price Chart | Source: TradingView
On the other hand, a bullish case could see ETH breakout above the upper trendline of the descending wedge with strong buying volume. A potential initial target could be the resistance level around the previous swing high NEAR $2200-$2400.
Meanwhile, the Relative Strength Index (RSI) currently reads around 36.31 suggesting that bears are dominating with the gradient of the line suggesting continued sideways movement until volume surges.
The Balance of Power indicator, which aims to measure the strength of buying and selling pressure, currently sits at -0.49. The negative value indicators that sellers have been in control of the price action.
nextBuy ETH? Tron Founder Remains Bullish amid Whale Purchases

Log in to Reply
Log in to comment your thoughtsComments
Related Articles
|Square
Get the BTCC app to start your crypto journey
Get started today Scan to join our 100M+ users