Ethereum Whales Accelerate Sell-Off as Market Downturn Persists – Analyzing Future Trends

As Ethereum (ETH) faces sustained downward pressure, large-scale holders (whales) have intensified their sell-off activities, contributing to the asset’s recent price decline. On-chain data reveals notable whale transactions moving ETH to exchanges, signaling potential further volatility. Analysts suggest this trend may reflect profit-taking after ETH’s Q1 rally or repositioning ahead of key network upgrades. Market sentiment remains cautious, with derivatives metrics showing increased put/call ratios. However, some institutional players view this as an accumulation opportunity, citing Ethereum’s strong fundamentals and upcoming protocol improvements. The next critical support level is observed at $2,800, while resistance stands firm at $3,200.
Opportunity amid the panic?
Despite the downturn, several analysts see this as a good buying opportunity for investors. Popular on-chain analyst Ali Martinez pointed out that Ethereum may be approaching a crucial support zone.
The most critical support for #Ethereum sits at $1,546.55, where 822,440 $ETH were previously accumulated. A level worth watching closely! pic.twitter.com/KkNK9zittT
— Ali (@ali_charts) April 15, 2025
According to Martinez, the $1,546 range has historically served as a strong foundation, with over 820,000 ETH previously accumulated at this zone.
He predicted that traders could see a potential rebound, citing a buy signal from the TD Sequential indicator on Ethereum’s weekly chart.
Ethereum (eth) price outlook
As of writing, Ethereum (ETH) is trading around $1,642, with a total market capitalization of over $198 billion. On the daily ETH price chart, the RSI is sitting around 42 with an upward gradient. This suggests that there is ample room for upward motion, though buying volume must rise.
It is important to note that an RSI fall below could point to additional price weakness.
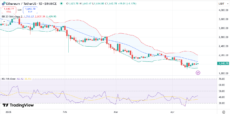
ETH Daily chart | Source: Trading View
The second-largest cryptocurrency is approaching the middle Bollinger Band (20-day SMA). If it sustainably holds this level around $1,655, traders can expect a bullish momentum, reaching the upper band (around $2,000).
On the other hand, the lower band (around $1,429) serves as a dynamic support for ETH.
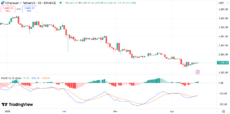
ETH Daily chart | Source: Trading View
Meanwhile, the MACD line remains below the signal line despite a mildly positive histogram, indicating slow upward momentum. If the price drops further below, it could head to $1,400, particularly if MACD crosses bearishly.
nextWhales Continue to Offload Ethereum Amid Market Slump, What’s Ahead?

Log in to Reply
Log in to comment your thoughtsComments
Related Articles
|Square
Get the BTCC app to start your crypto journey
Get started today Scan to join our 100M+ users