Litecoin Price Surge: Will LTC Smash $131 Before the Week Ends?

Litecoin bulls are charging—can the silver to Bitcoin's gold deliver a knockout punch this week?
With volatility spiking across crypto markets, traders are eyeing LTC's next move. The $131 target looms large, teasing a potential breakout before Sunday's closing bell.
Market mechanics at play
Litecoin's recent consolidation mirrors patterns seen before previous bull runs. The 4-hour chart shows tightening Bollinger Bands—a classic squeeze before potential fireworks.
Wall Street's watching (between martini lunches)
Traditional finance still scoffs at crypto's 'irrational' moves—right up until they FOMO in at all-time highs. This time? The joke might be on them.
Whether LTC hits $131 or not, one thing's certain: the crypto casino never sleeps. Place your bets.
Litecoin has risen from the shadows of consolidation to lead the altcoin charge. Which hodlers view as a phoenix moment for the altcoin. Since yesterday alone, LTC price has added over 10.85% in gains, with the 7-day rally staying at 12.73%.
Driven by increasing network activity, bullish ETF speculation, and key technical breakouts, LTC now trades around $122.85. This is pushing its market cap to $9.35 billion. With 24-hour volume surging 170% to $1.48 billion, traders are leveling up their targets. Curious about the weekly close of this token? If yes, then this short-term Litecoin price prediction is a must-read for you.
On-chain Insight
In a recent feat, Litecoin has processed its “, up from 300 million in early January 2025. This means that the network has put out 12% of all LTC transactions since 2011, in 2025 alone. And we still have 4 more months to close the year. The achievement highlights growing adoption and on-chain utility.
Litecoin Price Analysis
LTC’s breakout from a three-year consolidation pattern marks a significant shift in momentum. The asset surged past its multi-month resistance of $110.70 on August 4, flipping it into fresh support. As evident from the 4-hour chart, the Bollinger Bands have expanded sharply, signaling a volatility surge, with LTC now hugging the upper band at $122.94.
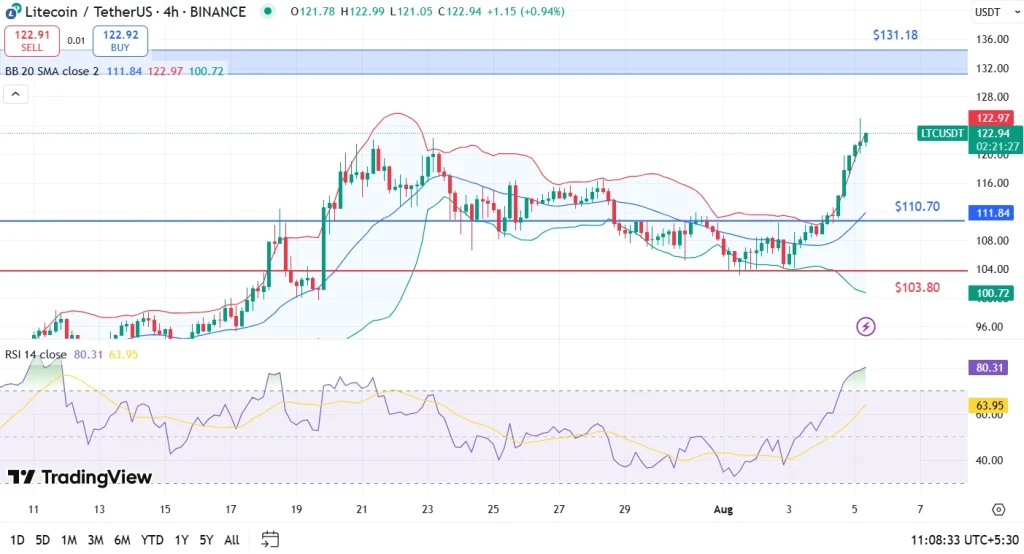
The RSI currently sits at 80.31, indicating overbought conditions. However, the bullish narrative is strengthened by the asset’s ability to maintain a price above the 20-period SMA at $111.84, and the latest green candle closing above prior resistance zones.
The chart shows a clean break above the 23.6% Fib at $110.70, with the next resistance at $131.18. That being said, if momentum sustains, a MOVE toward $144.56 looks achievable. On the downside, $110.70 remains the first support to watch, followed by $107.89. The stop loss for trades can be placed at $103.80, below the 38.2% retracement zone.
FAQs
Why is LTC’s price up today?LTC’s price broke out of a 3-year resistance, fueled by ETF Optimism and rising on-chain adoption.
Is Litecoin overbought at the current levels?The RSI at 80.31 suggests short-term overbought conditions, but broader momentum remains bullish.
What are the next targets for Litecoin?If LTC stays above $110.70, the next price targets are $131.18 and $144.56 in the near-to-mid term.
