Bitcoin Demand Dips: Temporary Fakeout or Launchpad for a Parabolic Surge?

Is Bitcoin's cooling demand a bear trap or the calm before a historic rally? The crypto king's latest pullback has traders split—while weak hands panic, whales are stacking sats.
Signs of a fakeout?
On-chain data shows exchange outflows spiking even as retail interest wanes—a classic accumulation signal. Meanwhile, futures open interest refuses to die, hinting at big players positioning for the next leg up.
Parabolic potential ahead
The 2024 halving's supply shock is just starting to bite. With institutional adoption accelerating (BlackRock's BTC ETF just hit $25B AUM), this could be the last discount before Wall Street fully FOMOs in. As always, the 'smart money' buys while CNBC warns of crypto winter.
Closing thought: If history rhymes, this 'demand drop' will look genius in hindsight—right after the suits finish shorting it to oblivion.
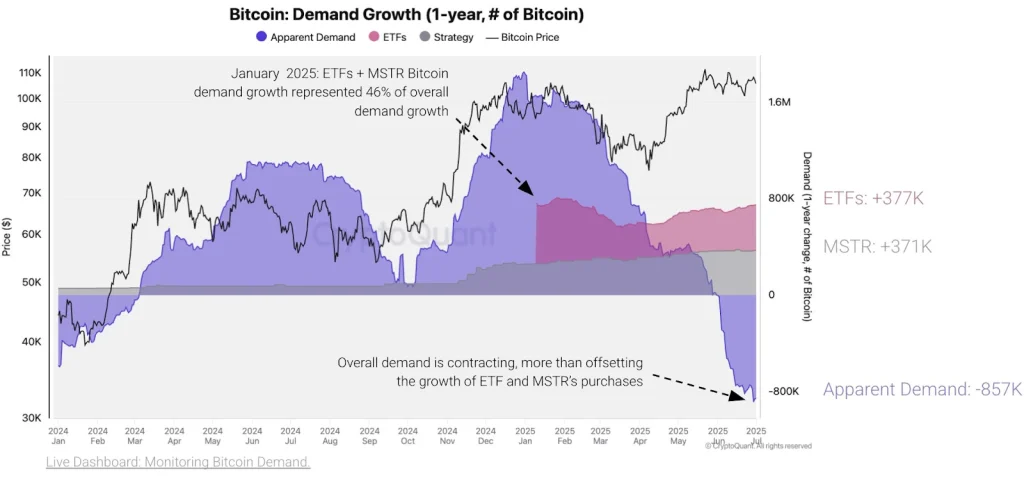
Bitcoin (BTC) has experienced reduced demand, especially from institutional investors despite the apparent net cash inflows in the last few weeks. According to on-chain data analysis provided by CryptoQuant, the net demand for Bitcoin has been falling in the recent past.
Precisely, the overall demand for bitcoin has contracted significantly, such that people purchasing Bitcoin reduced their demand by 895k coins in the past 30 days. The reduced Bitcoin demand amid significant cumulative short leverage trades has played a major role in its midterm bearish sentiment in recent weeks.
Bitcoin Price Gains Bullish Momentum
After closing above a crucial resistance level around $108,360 on Wednesday, Bitcoin (BTC) price rallied towards the next milestone of around $110,570 on Thursday, July 3. Consequently, the flagship coin has regained the 50-day SMA as a support level and is now aiming to retest its all-time high of nearly $112k.
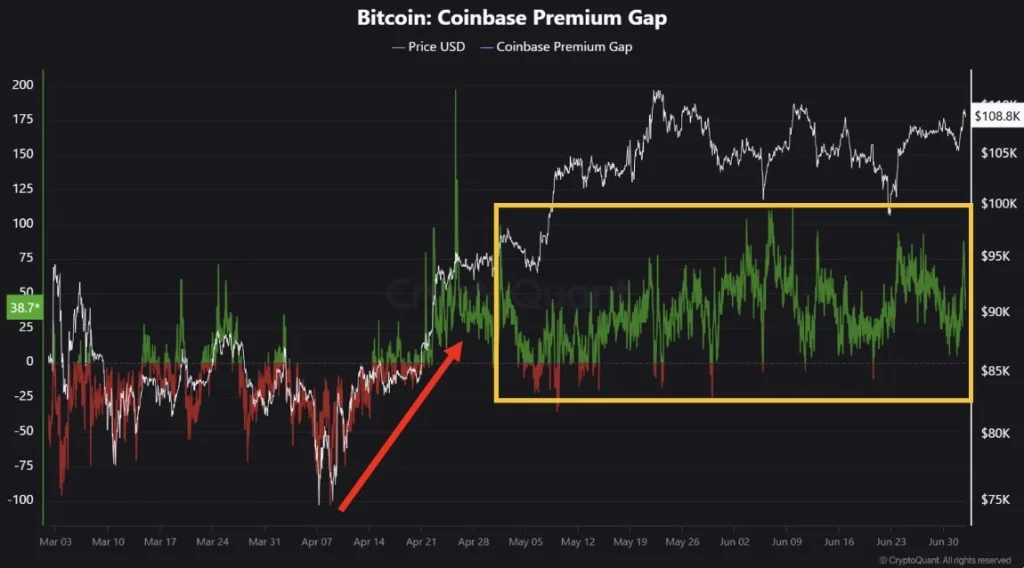
Furthermore, BTC price has invalidated the previously formed falling trend after closing above the upper border of the logarithmic trend. According to market data analysis from CryptoQuant, the selling pressure from U.S. whales and institutional investors, has gradually declined.
What the Charts Say
BTC price is approaching to retest the all-time high around $111,814, which signals a potential double top if a rejection occurs. With the daily Relative Strength Index (RSI) signaling a possible bearish divergence, it is prudent to wait for the BTC price to consistently close above $112k in the subsequent days to avoid being caught in a fakeout.
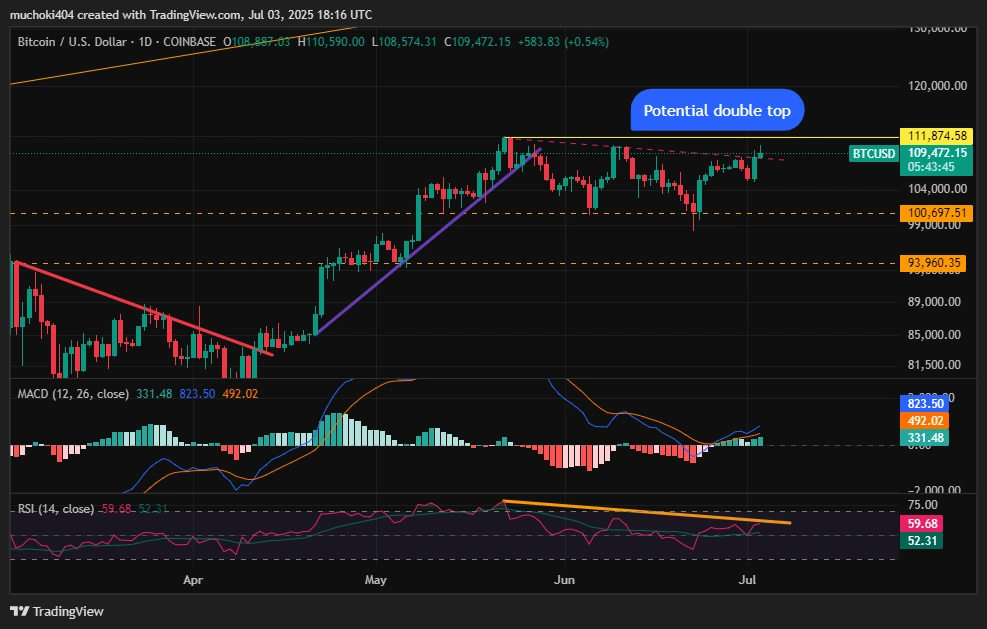
The daily MACD indicator also shows that the bullish sentiment has been gaining momentum, whereby the histograms have been increasing above the zero line. The bullish momentum is also bolstered by the fact that BTC price has registered more positive monthly returns in Julys in the past ten years.
