Global M2 Money Supply Explosion: Why Bitcoin & Crypto Are Primed for a Bull Run

Central banks keep printing—and Bitcoin's scarcity just got more attractive.
### The Liquidity Tsunami Hits Markets
With M2 supply swelling like a central banker’s balance sheet, hard-capped assets are flashing buy signals. Crypto doesn’t dilute—unlike your fiat paycheck.
### Scarcity Wins in Inflationary Times
When every dollar printed makes existing dollars weaker, 21 million BTC starts looking like a life raft. Gold 2.0? Try Gold on algorithmic steroids.
### The Institutional Endgame
Hedge funds aren’t stacking SATs for fun. They’ve read the room: debasement requires hedges that scale. Enter crypto’s trillion-dollar opportunity.
Wake-up call: Your bank’s ‘high-yield’ savings account loses to inflation. Again. Meanwhile, Bitcoin’s doing what it does best—ignoring monetary malpractice.

Global M2 supply refers to the total amount of money available for spending and investment across the world’s major economies. A rise in the levels suggests more money available, while a drop suggests less liquidity available within the markets. In an interesting update, the levels are expanding at a rapid 8.77% year-over-year, which appears to be a big deal, especially for Bitcoin.
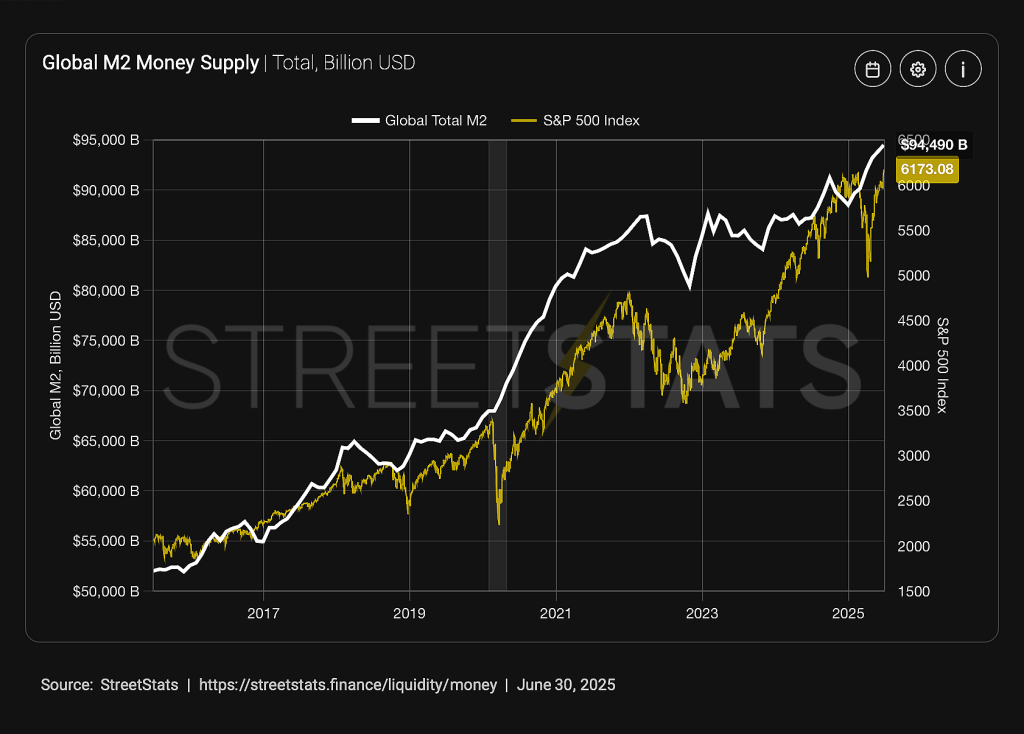
In simple terms, the rise suggests an increase in total money flowing through the global economy, including cash, checking deposits, savings, and other near-money assets. When this number grows fast, it means central banks are pumping liquidity into the system, often to stimulate growth or manage debt, which has historically been bullish for Bitcoin.
Correlation Between M2 Growth & Bitcoin
As the central banks inject liquidity, real yields tend to compress or even turn negative, which makes non-yielding assets like Bitcoin more attractive. Moreover, with a supply cap of 21 million, the crypto has zero monetary inflation, which suggests it doesn’t dilute like fiat currencies. Therefore, in the times when Fiat is expanding at nearly 9% annually, BTC’s scarcity could become a feature but not a bug.
Historically, Bitcoin’s strongest bull markets align with periods of aggressive M2 expansion. Back in 2020-21, post-COVID QE had pushed M2 growth to double digits, which pushed the BTC price by 8x. Further, in 2022, M2 growth slowed while the Fed hiked aggressively, due to which the BTC price corrected by nearly 75%. Later in 2024-25, with M2 again expanding near 9%, the setup is macro-bullish.
What’s Next for BTC Price—How High Can it go in 2025?
After a close consolidation along the crucial support at $106.6K, the Bitcoin price tried changing hands above $108K, which attracted bearish attention. However, the token successfully secures the support and hence, a bullish continuation could be imminent.
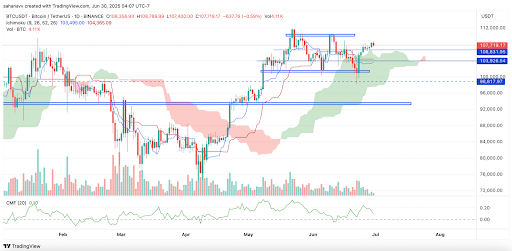
As seen in the above chart, the BTC price continues to hover close to its highs above $111K, withstanding the bearish pressure occurring at frequent intervals. In the times when the Ichimoku cloud is bearish, the levels are approaching for a bullish crossover, and the CMF maintains a steep descending trend. This keeps the bullish and the bearish hopes alive for the BTC price rally.
If the bitcoin (BTC) price rises successfully above the current consolidation, then the token may reach a new ATH. However, a failure could eventually drag the levels below the local support and compel it to maintain a horizontal consolidation for some more time.
