RAY Price Primed for Explosive Rally Following 600% Volume Spike?

Raydium's native token just flashed its most bullish signal in months—a 600% surge in trading volume. Is this the ignition sequence for another leg up?
Whales are circling
The volume spike suggests big players are accumulating RAY at current levels. Market depth charts show buy walls stacking up like a crypto version of GameStop's 2021 squeeze—except this time, the fundamentals might actually justify the hype.
Technical breakout imminent
RAY's price action is coiling tighter than a spring at the apex of a symmetrical triangle. The last time this pattern appeared? A 300% rally followed. History doesn't repeat, but it often rhymes—especially in crypto.
DeFi's quiet outperformer
While everyone obsesses over Ethereum L2s, Solana's flagship DEX has been quietly eating market share. TVL up 47% quarter-over-quarter, with RAY staking yields still beating 90% of CeFi options (not that yields ever go bad in crypto... right?)
The bottom line: This looks like more than just another dead cat bounce. But in a market where 'fundamentals' mean whatever pumps your bags, maybe just enjoy the ride.
Raydium is gaining renewed investor interest, all thanks to its strong fundamentals. As per recent stats, Raydium boasts a TVL of $1.86 billion and an impressive annual revenue of $655.9 million. What has caught the attention of many is that its capital efficiency metrics shine, it holds a Revenue/Market Cap ratio of 19.2% and TVL/Market Cap of 2.84x.
Moreover, with $67.2 million (11.9%) staked, investor conviction appears to be stout. As RAY’s price experiences a sharp intraday rebound, traders are closely watching to see whether this surge signals a broader recovery or short-term volatility. Join me as I derive the Raydium (RAY) price analysis for the NEAR term.
RAY Price vs Volatility: Weekly Comparison
Recalling numbers from the recent past, as of April 30, 2025, RAY traded at $2.84 with a 1-week price volatility of 0.0609. Fast forward to today, that is, June 19, RAY’s current price stands at $2.27, with afrom the earlier high.
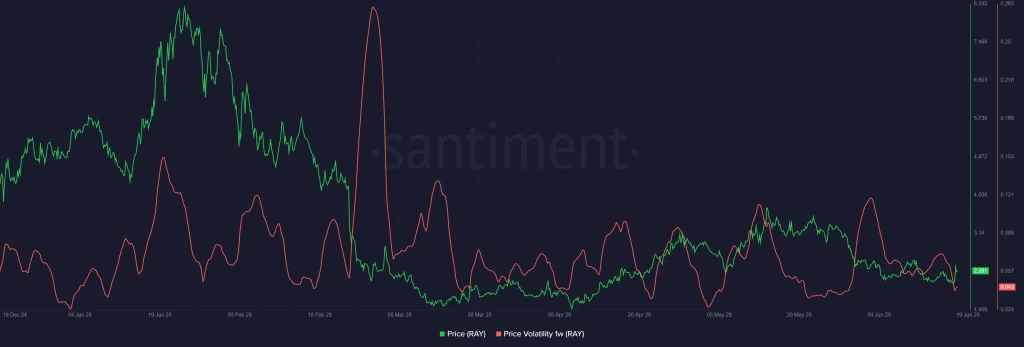
However, despite this drawdown, the token has stabilized and rebounded nearly 10% in the past 24 hours, while weekly gains sit at a modest +1.05%. Volatility seems to have compressed slightly, as reflected in the tighter Bollinger Bands on the chart. This indicates a reduction in price swings and a potential build-up for a new directional move.
RAY Price Analysis: Bullish Break or Temporary Spike?
RAY’s recent price surge has injected fresh momentum into its price structure. The 4-hour chart reveals a breakout above the midline of the Bollinger Bands in 20 SMA at $2.15, suggesting bullish sentiment is taking hold. Price action pushed through resistance at $2.10 and briefly tested $2.64 before pulling back.
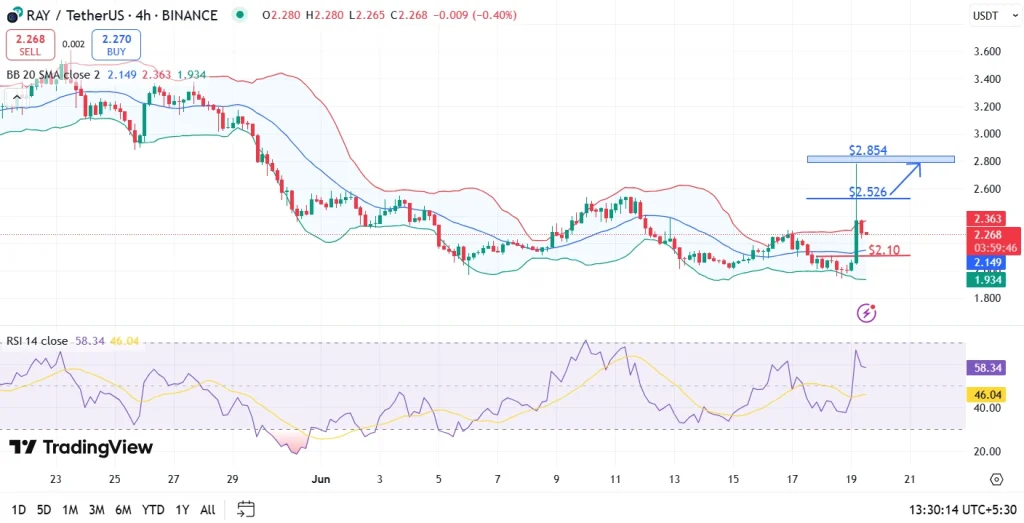
At present, the token is trading at $2.27, holding above key short-term support at $2.10. The 10% daily spike was catalysed by a 609% surge in intraday trading volume, which tallied to $401.19 million. A decisive breakout and close above $2.526 could pave the way for a further push toward the target at $2.854. The RSI stands at 58.34, hovering just below overbought territory, implying room for additional upside while still allowing caution for volatility.
Also read our Raydium (RAY) Price Prediction 2025, 2026-2030!
FAQs
What triggered RAY’s sudden price surge?A sharp uptick in volume and breakout above $2.10 support likely led to short-covering and fresh buying, pushing RAY up 9.9% in 24 hours.
Is the current trend sustainable?It depends on whether RAY can close above $2.526 resistance with sustained volume. Otherwise, a retest of $2.10 support is possible.
What are the next levels to watch?Key levels include support at $2.10, resistance at $2.526, and a breakout target of $2.854.

Log in to Reply
Log in to comment your thoughtsComments
Related Articles
|Square
Get the BTCC app to start your crypto journey
Get started today Scan to join our 100M+ users