Virtual Protocol Smashes Resistance—Second Parabolic Rally Eyes $3 Target

VIRTUAL isn’t asking for permission—it’s bulldozing through key resistance levels like a crypto wrecking ball. The second parabolic surge in its short history just kicked off, and traders are scrambling for position.
Price action turned vicious overnight, slicing through sell orders like they were wet tissue paper. Now the charts scream one thing: $3 or bust. Funny how these ’decentralized’ moves always seem to follow the same pump-playbook Wall Street wrote decades ago.
Will the rally hold? Who knows. But right now, Virtual Protocol’s eating every limit sell in its path—and leaving bagholders in the dust.

Key Highlights:
- VIRTUAL has gained 89.89% in May, currently trading at $2.39 with MCap of $1.56B
- Futures Open Interest surged from $35M in April to $239M by May 9; now at $299M.
- Daily trading volume hit $2.14B on May 9, currently at $1.38B.
- Momentum remains strong. Trend is bullish, but traders should watch for signs of exhaustion near resistance.
- Price has surpassed the $2.20 breakout zone, signalling a strong continuation setup.
VIRTUAL/USD Price Analysis: Second Parabolic Rally in Progress
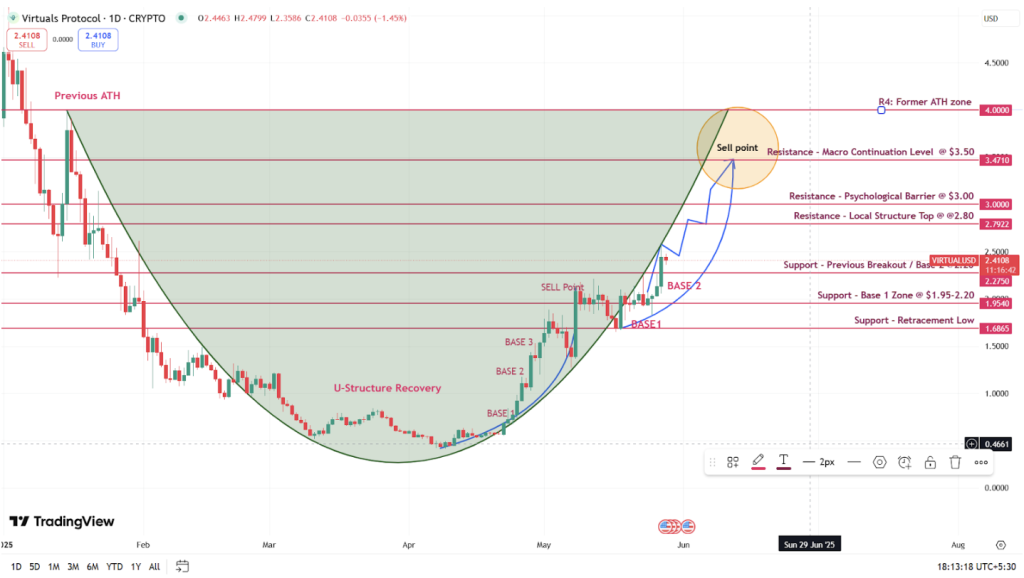
The April rally lifted VIRTUAL by 275%, from $0.60 to $2.25, forming three base structures before the vertical breakout. Since the May low of $1.68, VIRTUAL has formed another parabolic arc:
- Base 1: $1.95–$2.00 — initial consolidation.
- Base 2: $2.20 — breakout and continuation level.
The current price structure mirrors the first parabola, now approaching higher resistances. A U-shaped recovery from April to May has confirmed structural strength and dip buying.
Key Levels:
- Support Levels:
- $2.20 — Base 2 breakout zone.
- $1.95–$2.00 — Base 1 zone.
- $1.68 — retracement low from early May.
- Resistance Levels:
- $2.80 — local structure top.
- $3.00 — psychological breakout barrier.
- $3.50 — macro continuation level.
- $3.87–$4.00 — long-term ATH zone from January.
Growth Catalyst
Key Levels:
$1.95–$2.00 (Base 1), $2.20 (Base 2), $1.68 (retracement low)
$2.80 (local structure top), $3.00 (psychological breakout), $3.50 (macro continuation)
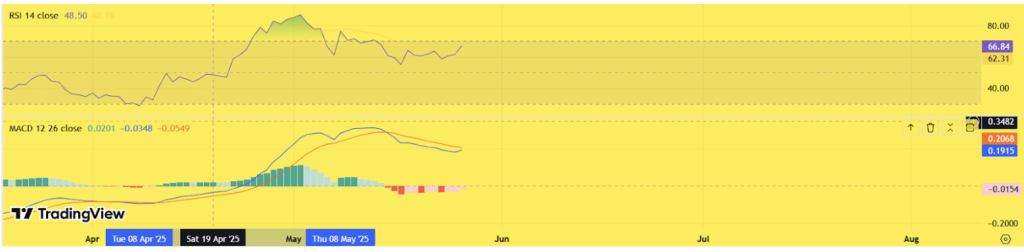
- RSI: 66.84 — showing strong bullish momentum nearing overbought levels.
- MACD: Flattening with a potential bullish crossover by early June, suggesting renewed upside strength.
On-Chain Metrics: Speculative Strength Holds
Futures Open Interest:
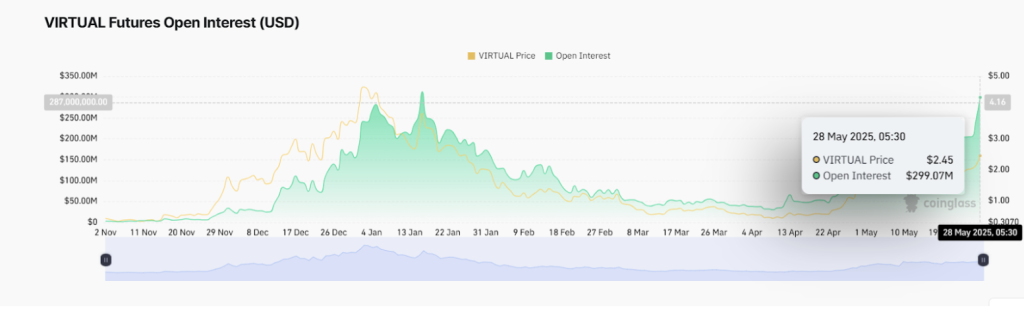
Futures open interest soared from $35.2M on April 11 (at $0.45) to $239.56M by May 9 ($2.09). As of May 28, open interest sits at $299.07M with price at $2.39 — just below its January high of $312.53M when VIRTUAL traded at $3.81. This shows rising Leveraged positioning and speculative conviction.
Trading Volume:
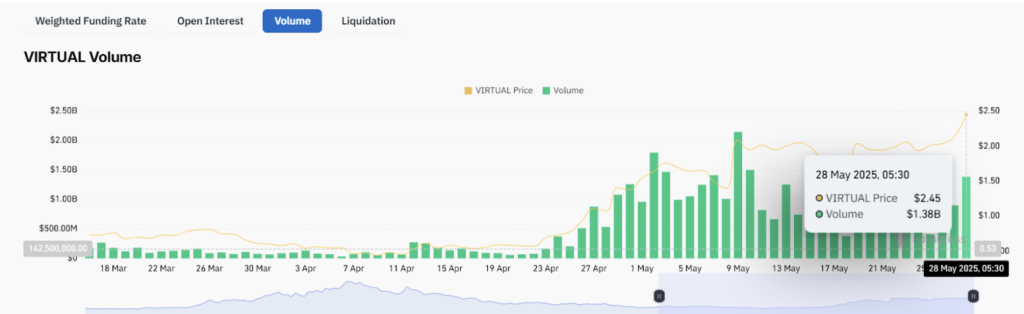
Volume peaked at $2.14B on May 9, then dipped to $1.11B on May 24. As of May 28, it has rebounded to $1.38B, showing renewed interest and sufficient liquidity for continuation.
Growth Catalysts Fueling the Rally
- Genesis Launchpad (April 17): Introduced a new token distribution mechanism, triggering fresh user interest and participation.
- Binance.US Listing (April 29): Significantly expanded trading access and improved liquidity through a top-tier exchange.
- Narrative Momentum: Branding as an AI-agent prediction protocol has attracted speculative attention from trend-focused traders.
- Influencer Engagement: Prominent crypto analysts highlighting VIRTUAL’s outperformance against ETH and SOL have boosted its visibility.VIRTUAL Price Prediction: Can Bulls Reach $3.00?
VIRTUAL Price Prediction: Can Bulls Reach $3 ?
VIRTUAL remains in a confirmed parabolic rally, supported by high open interest and strong volume. If price holds above $2.20 and breaks $2.80 with strength, the path toward $3.00 becomes likely. The current U-shaped recovery reflects a continuation of the macro trend.
- Possible short-term pullbacks to $2.35–$2.40.
- A revisit to $2.20 remains healthy within the arc structure.
- Breakout above $2.80 could send VIRTUAL to $3.00.
- If $3.00 breaks with volume, next resistance is $3.50.
- Beyond that, $3.87–$4.00 becomes the macro breakout target.
The parabolic structure remains valid as long asholds. Failure below this level could break the curve.
