XRP Price Outlook for May 25: Will Bulls Break Resistance or Face Another Rejection?

XRP traders brace for volatility as the token tests key levels—will May 25 mark a breakout or another fakeout?
Technical indicators hint at a make-or-break moment. Ripple’s ongoing legal saga with the SEC looms large, because nothing says ’stable investment’ like a cryptocurrency tied to courtroom drama.
Watch for volume spikes: low liquidity could amplify swings as speculators chase the next pump. Meanwhile, Bitcoin’s dominance wavers—altcoins like XRP often ride its coattails or get trampled in the rush.
Pro tip: If the chart starts looking like a cardiogram, maybe just walk away. The market’s heart hasn’t stopped racing since 2017.
The XRP market has been moving sideways lately, and analysts are eager to see whether a breakout or a deeper pullback comes next. Let’s break down what’s happening on the charts right now and what could be in store for XRP in the short and medium term.
Short-Term XRP Price Action
XRP recently experienced a mild pullback, following the broader crypto market’s cooling trend. The price dropped below a key retracement level but managed to find solid support around $2.30 — a level analysts had been closely watching. This price area between $2.30 and $2.34 served as a safety net, with XRP bouncing off its lower boundary.
However, if the price begins closing daily candles below $2.30, and fails to quickly reclaim it, the chances of further decline increase. In that case, the next important support lies around $2.10 to $2.15.
Is the Bullish Trend Still Intact?
Despite recent pullbacks, the broader trend for XRP remains bullish for now. The price continues to FORM higher highs and higher lows, a classic sign of an uptrend. What the market is seeing right now is more of a temporary pause in that bullish momentum.
As for resistance, immediate pressure sits at $2.44, while a more important resistance zone stretches from $2.55 to $2.62. Overcoming these levels WOULD be a crucial step for bulls to regain control.
A Possible Inverse Head and Shoulders Forming?
Interestingly, if XRP continues to pull back towards $2.10–$2.15 and bounces from there, it could lay the groundwork for a massive inverse head and shoulders pattern on the daily chart. This classic bullish formation often signals a major trend reversal if confirmed.
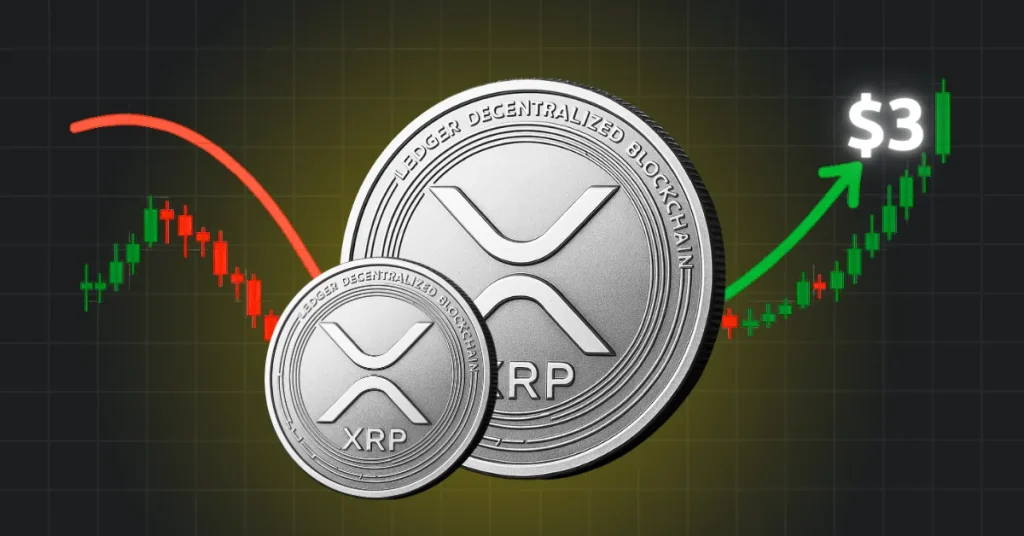
At the moment, this pattern isn’t confirmed — it’s only a possible setup to monitor. But if it does take shape and XRP manages to break above the golden pocket retracement zone afterward, it could open doors to a powerful rally. In fact, if the pattern plays out fully, analysts predict XRP could aim for targets beyond $3, potentially setting new all-time highs.

One scenario that some analysts are considering involves a five-wave decline structure already unfolding from the recent high. If this plays out, XRP could be working on a Wave 2 retracement now, before potentially heading lower again to test major support levels.
Micro-resistance levels to watch in this scenario include the $2.35 to $2.44 range. A rejection here could keep downward pressure intact in the coming sessions.
