Shiba Inu Collides With Bearish EMA Stack—Can the Meme Coin Defend $0.00001450?

Shiba Inu’s rally hits a wall—rejected hard in early May, now staring down a grim EMA stack. The so-called ’Dogecoin killer’ wobbles as traders brace for a make-or-break moment at $0.00001450.
Technical carnage or bullish trap? SHIB’s chart paints a messy picture after failing to hold gains. Another day, another crypto asset pretending it’s not a casino chip.
If the support cracks, expect a scramble. If it holds... well, even meme coins get lucky sometimes.
Key Highlights:
- SHIB trades near $0.00001460, down 17% from its May high, after losing early-month momentum.
- Shibarium’s $1.5M TVL surge pushed SHIB to $0.00001757, but gains quickly faded.
- Price remains below the 50, 100, and 200-day EMAs, confirming a bearish setup.
- Whale netflows are down -311%, and active addresses have dropped 68% since December.
- MACD, RSI, and CMF all show weak or neutral momentum, suggesting consolidation or further downside.
From May 8 to 11, Shiba Inu, the first major dog-themed memecoin launched on ethereum began another price rally due to a variety of catalysts.
This includes marketing leadstating a price prediction of 1,000% increase, and increased excitement surrounding Shibarium, which is a Layer-2 blockchain.
During this period, Shibarium’s total value locked (TVL) increased over $1.5M to $3.79M and both these figures gave hope towards a more prominent adoption of shiba inu on a much broader level.
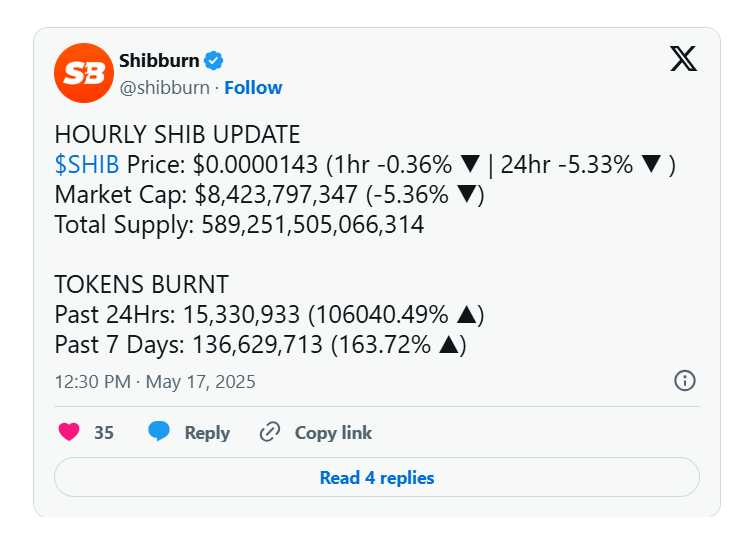
Though, the price rally did not hold its momentum. On May 17, Shibburn’s tracker noted an incredible 106,040% spike in their 24-hour burn rate, but SHIB fell to -5.3% the same day, producing a lower high confirming bearish setup.
SHIB/USD Technical Analysis: Bearish EMA Stack Confirms Trend Weakness
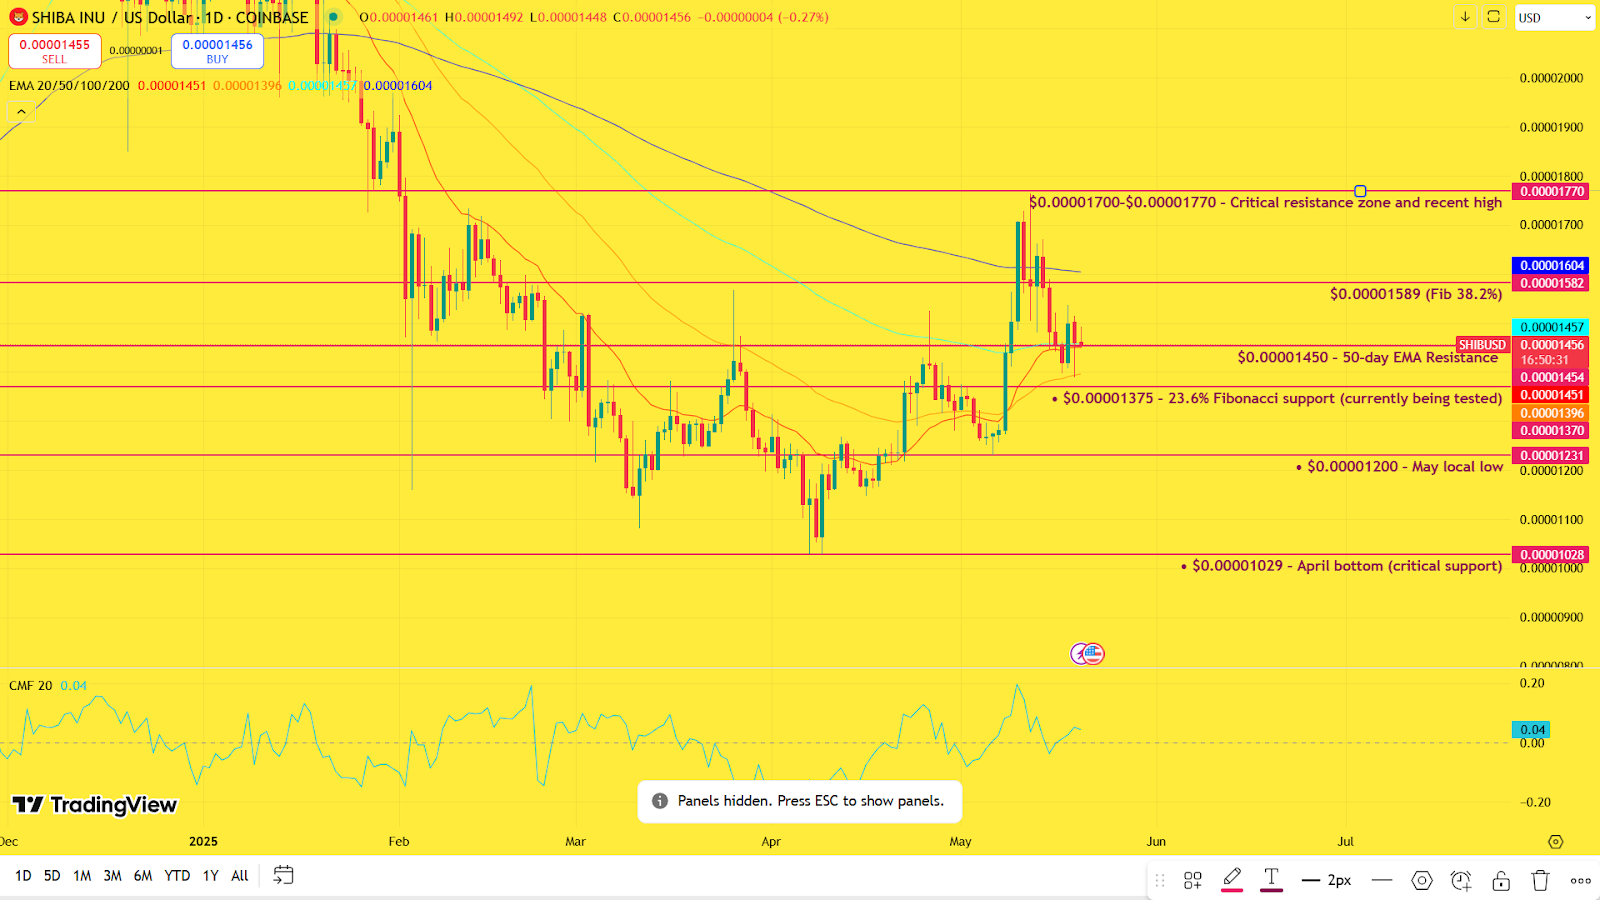
ShubaInu Price is currently attempting to hold above its 20-day EMA near, but price continues to face rejection at the 50-day EMA — keeping the. Unless SHIB reclaims(38.2% Fib level) with strong momentum, the broader trend remains weak.
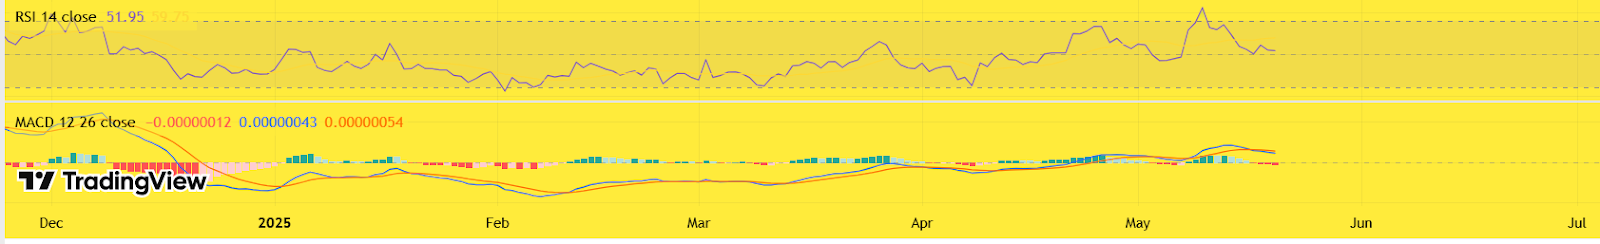
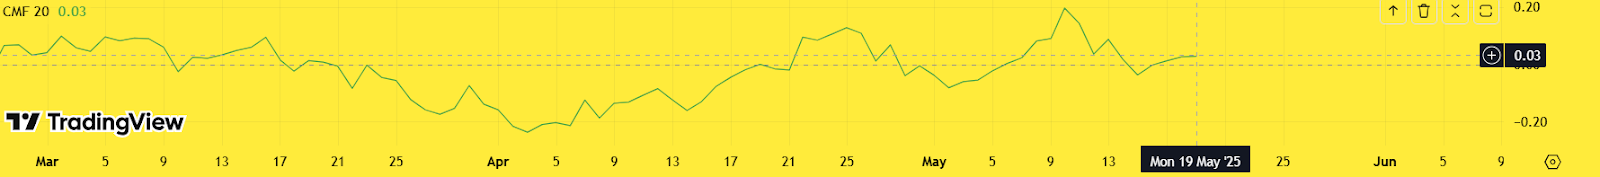
The RSI has slipped to 52.4, down from 59.7 during the recent peak, signaling fading bullish strength. Meanwhile, the Chaikin Money FLOW (CMF) has turned negative at -0.06, falling from +0.18 — a clear sign that capital inflows have dried up and accumulation interest is lacking.
SHIB now hovers NEAR $0.00001375, the 23.6% Fibonacci retracement. If this level breaks, downside risk extends toward $0.00001200, with the critical April bottom at $0.00001029 acting as the final major support. Until price breaks above the $0.00001450–$0.00001600 zone with volume confirmation, the technical outlook remains bearish.
On-Chain Metrics: Whales Exit as Retail Loses Interest
Shuba Inu Coin On-chain data further confirms the bearish setup, revealing cautious behavior from both whales and retail trade
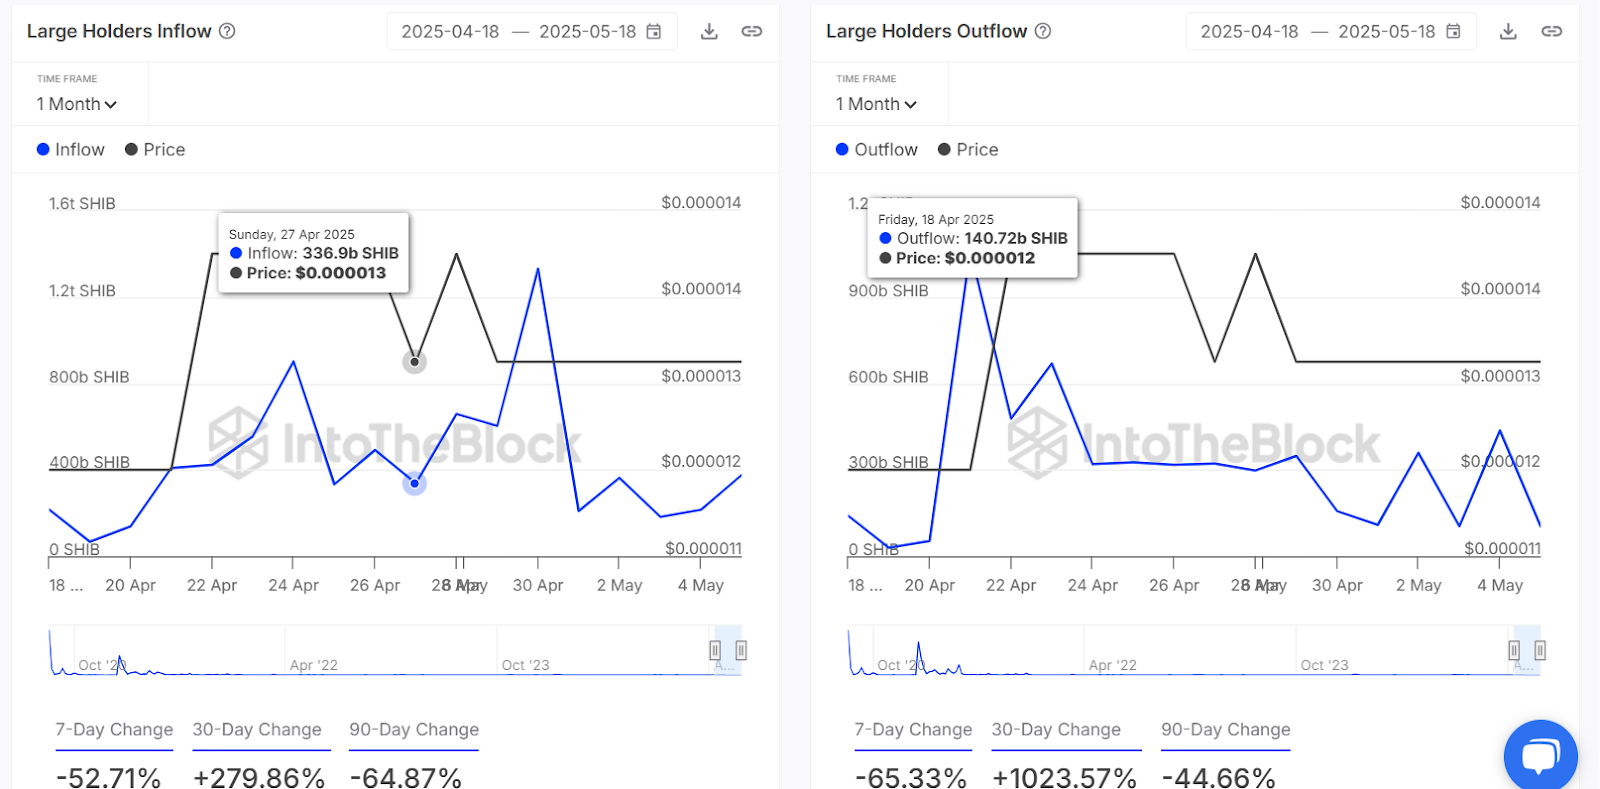
On-chain data confirms bearish momentum. Over the last 30 days, large holder netflow dropped, showing that whales reduced exposure and likely moved tokens to exchanges during the early May rally.
Whale outflows surged over, signaling aggressive exits as SHIB briefly rallied — a clear indication that the burn HYPE was used as exit liquidity rather than a reason to accumulate.
Profitability Metrics: 80% of Holders Are in Loss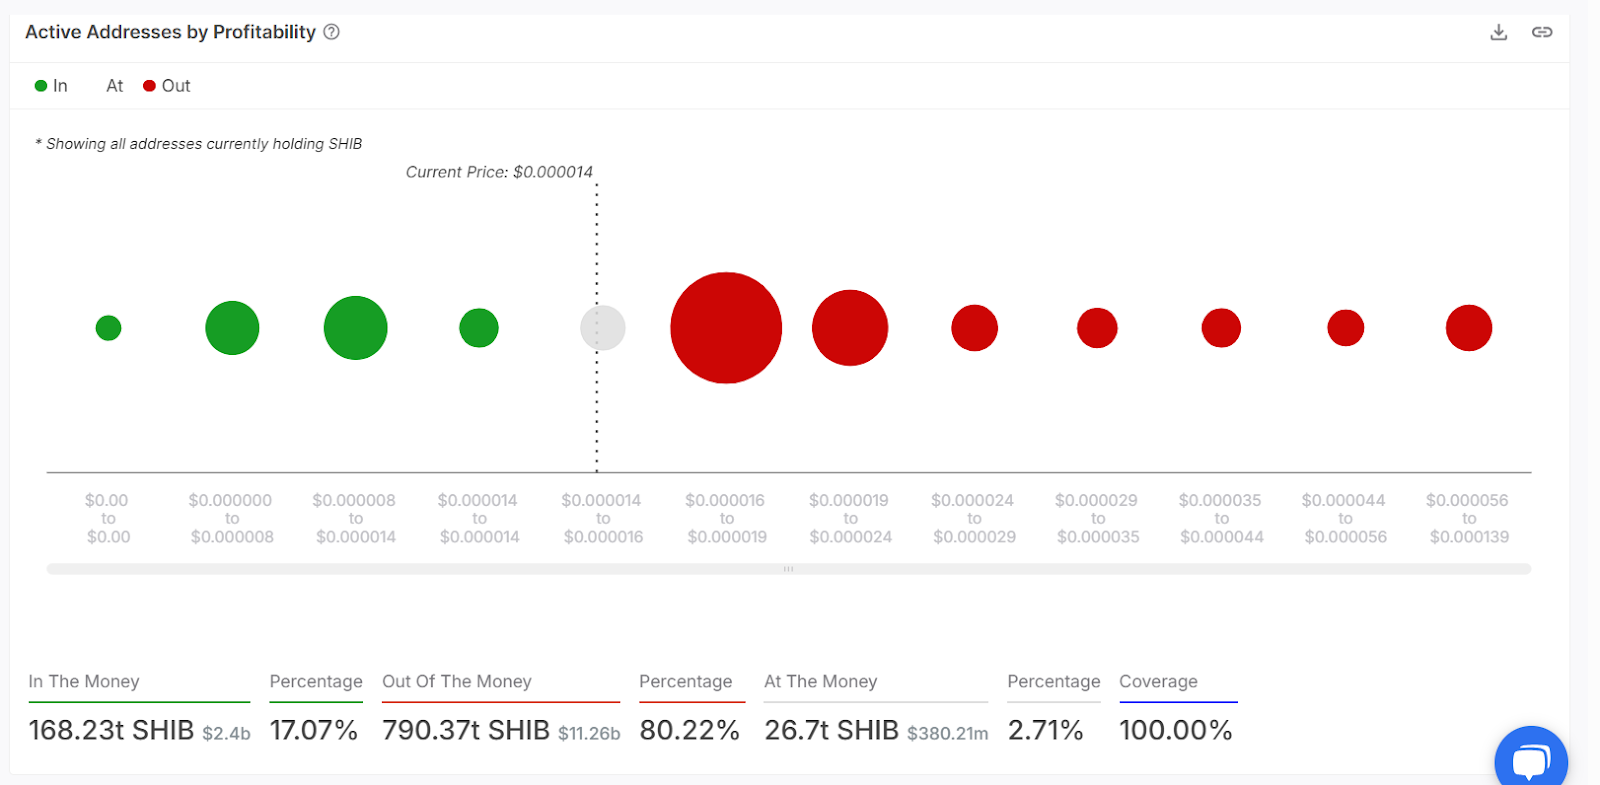
Only 17% of SHIB holders are currently making a profit, while over 80% are holding at a loss. This means if the price rises, many traders might sell quickly just to recover their money, which could stop the rally from continuing.
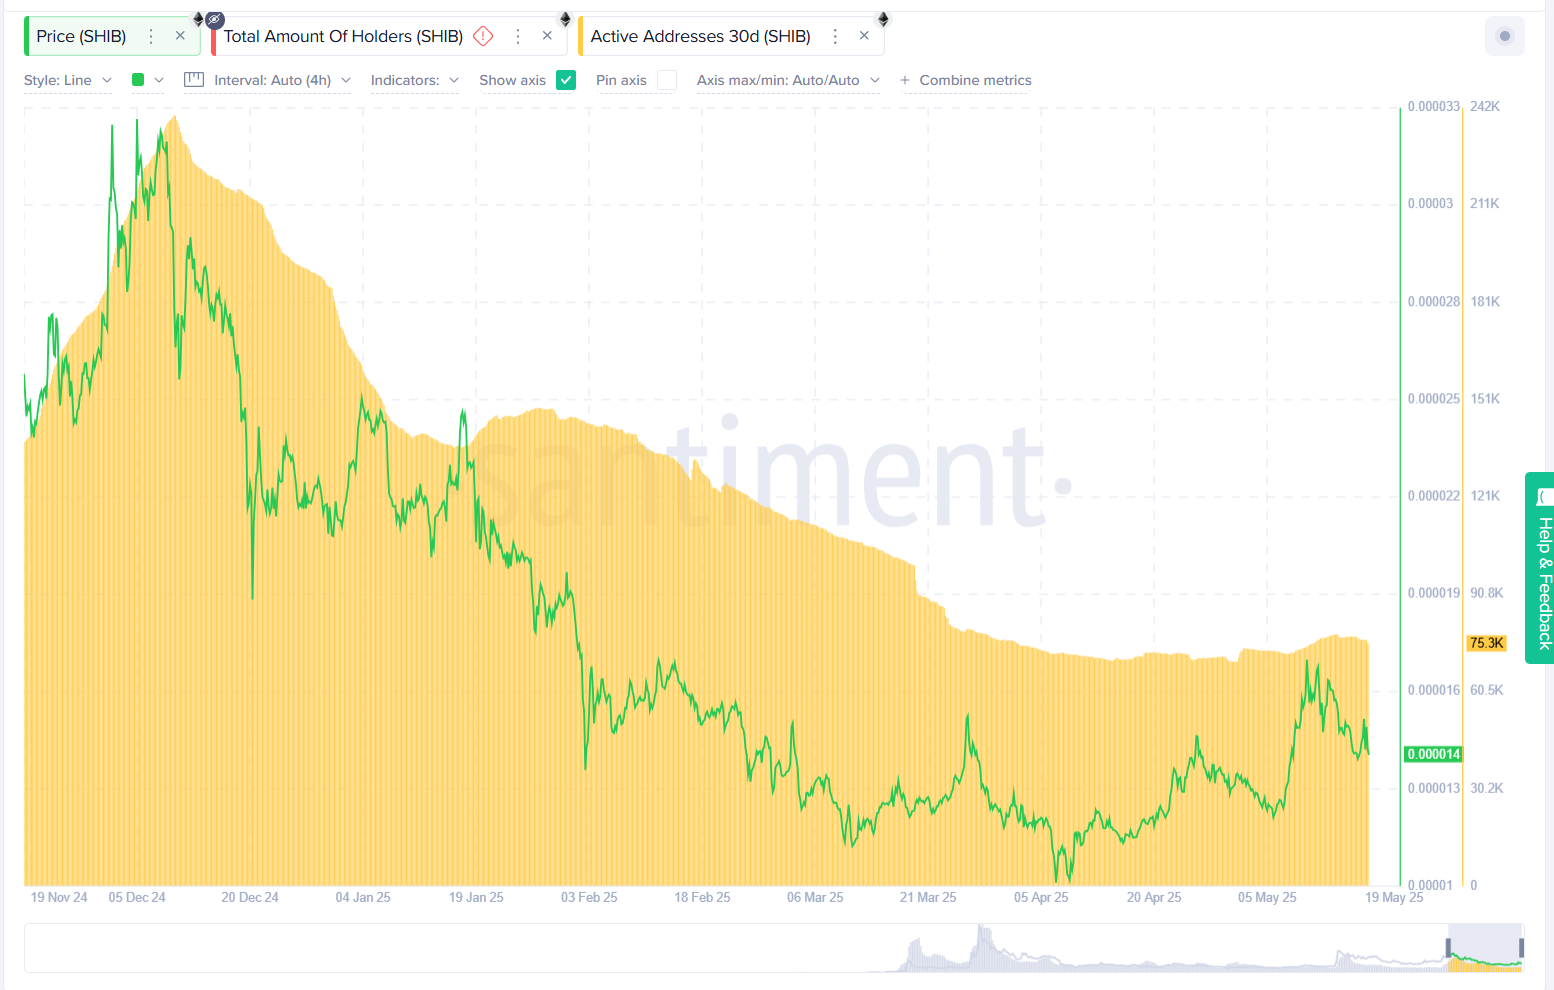
According to Santiment,have dropped fromto, showing.
Futures Open Interest Down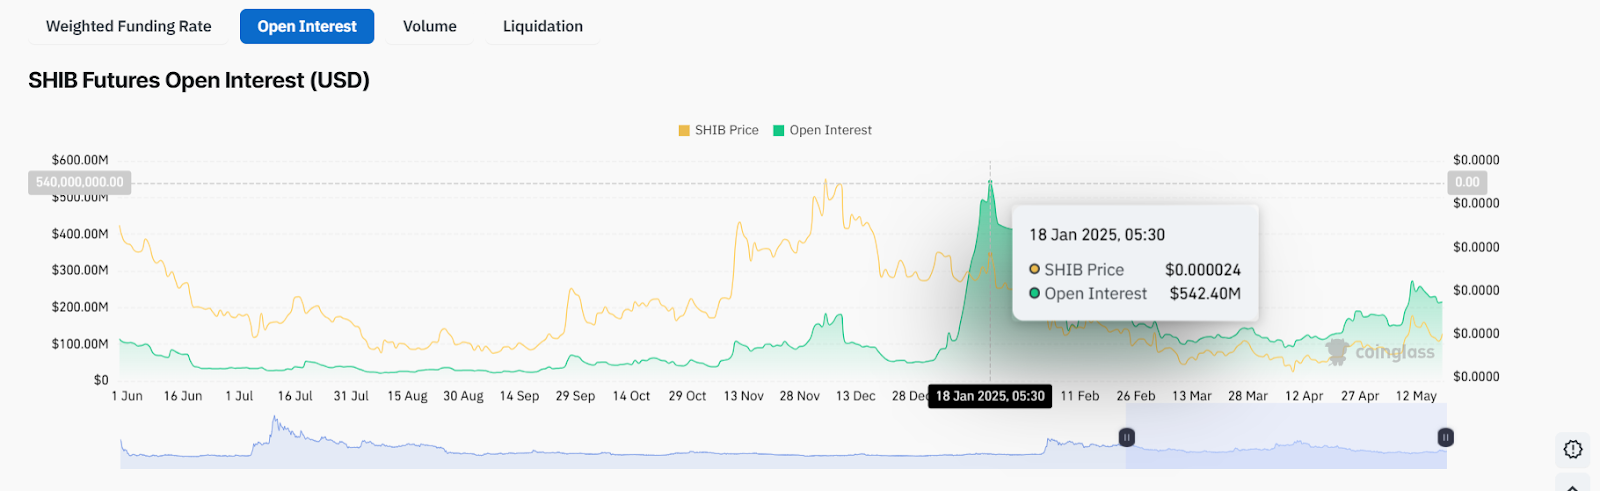
SHIB futures Open Interest has declined from $542M in January to much lower levels — a sign that traders are stepping away from high-leverage positions amid unclear momentum.
Conclusion: Bias Leans Bearish Unless $0.00001600 is Reclaimed
SHIB remains in a bearish structure, trading below key EMAs, with $0.00001450 acting as a make-or-break level. If this support holds, a short-term bounce toward $0.00001589–$0.00001700 is possible.
However, unless SHIB reclaims and sustains above $0.00001600, downside pressure may continue. A break below $0.00001375 could open the path to $0.00001200 or $0.00001029 in the coming weeks.
From a trader’s standpoint, the, but keep an eye on volume and whale flows for signs of accumulation or reversal. A decisive trend shift may not occur before, unless fueled by strong catalysts.

Log in to Reply
Log in to comment your thoughtsComments
Related Articles
|Square
Get the BTCC app to start your crypto journey
Get started today Scan to join our 100M+ users