Dogwifhat (WIF) Surges 133%—Can Bulls Push It to $1.50 or Is This Another Crypto Sugar Rush?

Meme coin madness strikes again as WIF defies gravity with a parabolic breakout. Traders are now eyeing the $1.50 threshold—but with 24-hour leverage liquidations hitting record highs, the real question is whether this rally has more legs than your average degenerate gambler’s ’sure thing.’
Technical indicators scream overbought, yet retail FOMO keeps pouring gasoline on the fire. Just remember: in crypto, what goes up 133% in a week usually comes down twice as fast. Happy trading, and may your stop-losses be ever in your favor.

Key Highlights:
- WIF surged 133% in 30 days, breaking out of a multi-month accumulation zone.
- Price eyes $1.50 next, with $1.00 as a key resistance to watch.
- On-chain data shows rising Open Interest and whale activity fueling the rally.
- Recent inflow hints at potential profit-taking; RSI indicates overbought conditions.
- Analysts maintain a cautiously bullish outlook if support at $0.70–$0.85 holds.
, the 4th largest solana memecoin has surgedclimbing from ~$0.35 to ~$0.88 after breaking out of itsin early April 2025.
A key catalyst was thewhich sparked bullish momentum.
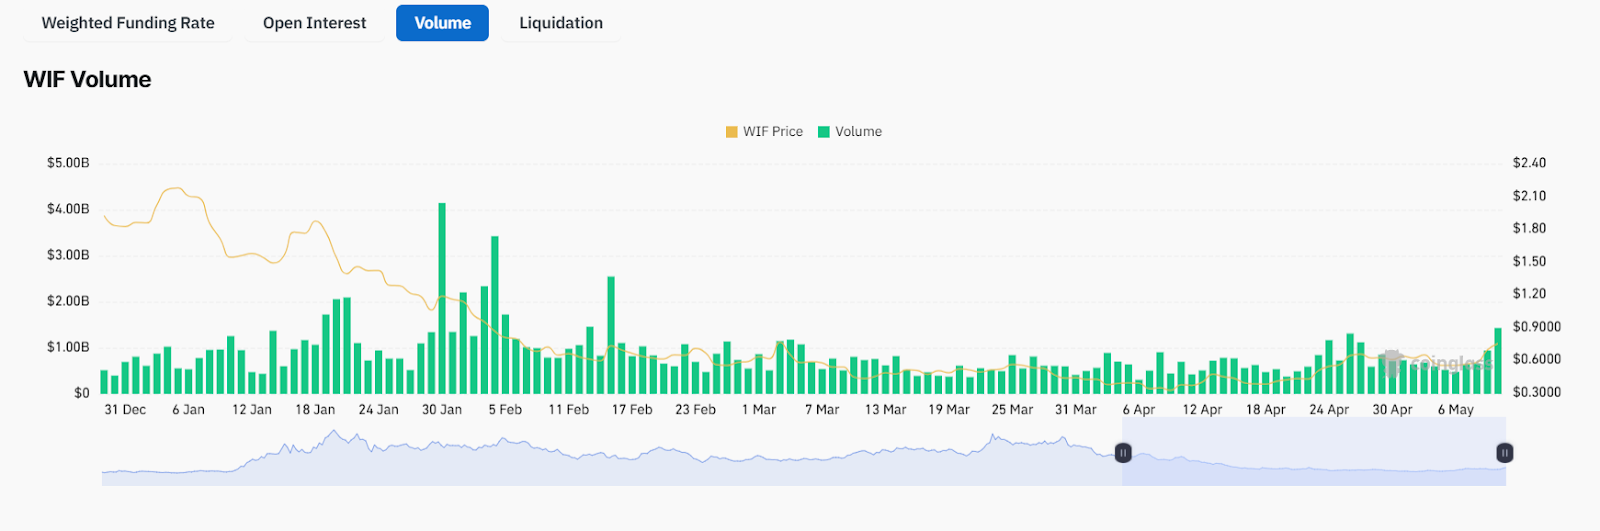
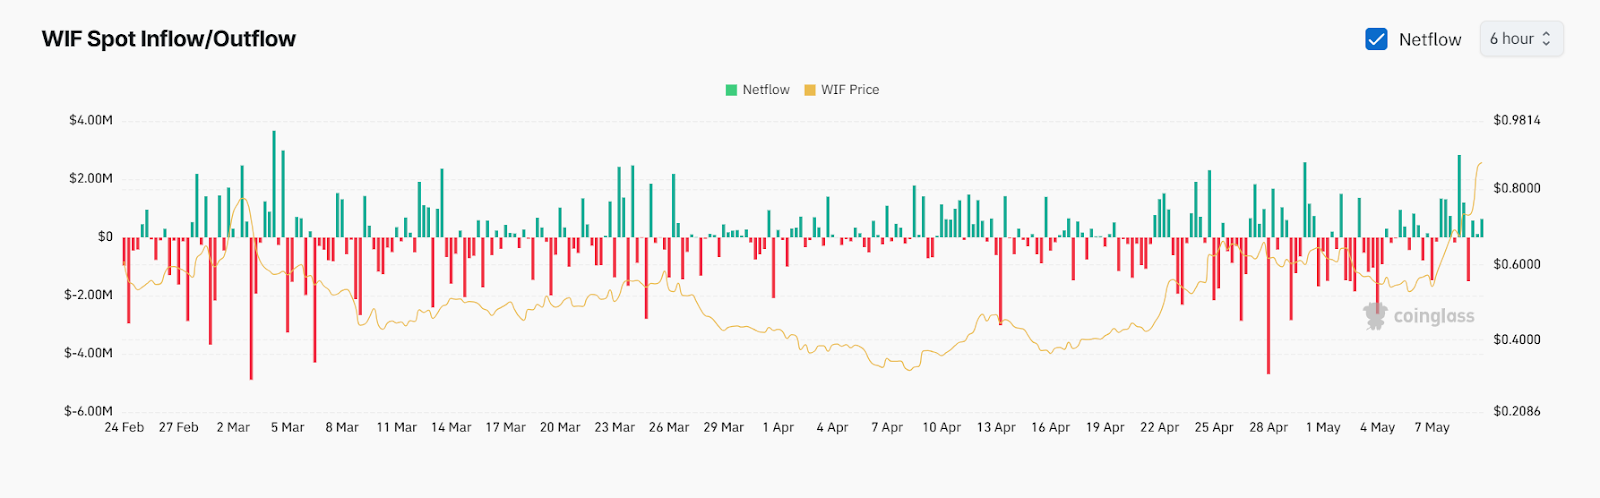
On-chain data from CoinGlass showsrising from ~$120M towhile daily trading volume doubled from ~$400M to $900M. Whale outflows peaked atconfirming accumulation, with a recenthinting at profit-taking.
Traders now eye thewith potential to testif momentum holds. Technicals highlight a bullish setup: WIF trades above its 50-day SMA, Bollinger Bands are expanding, and RSI (~78) flags possible short-term cooling.
Dogwifhat (WIF) Breakout Signals: Bollinger Bands Expansion & 50-Day SMA Indicate Bullish Momentum
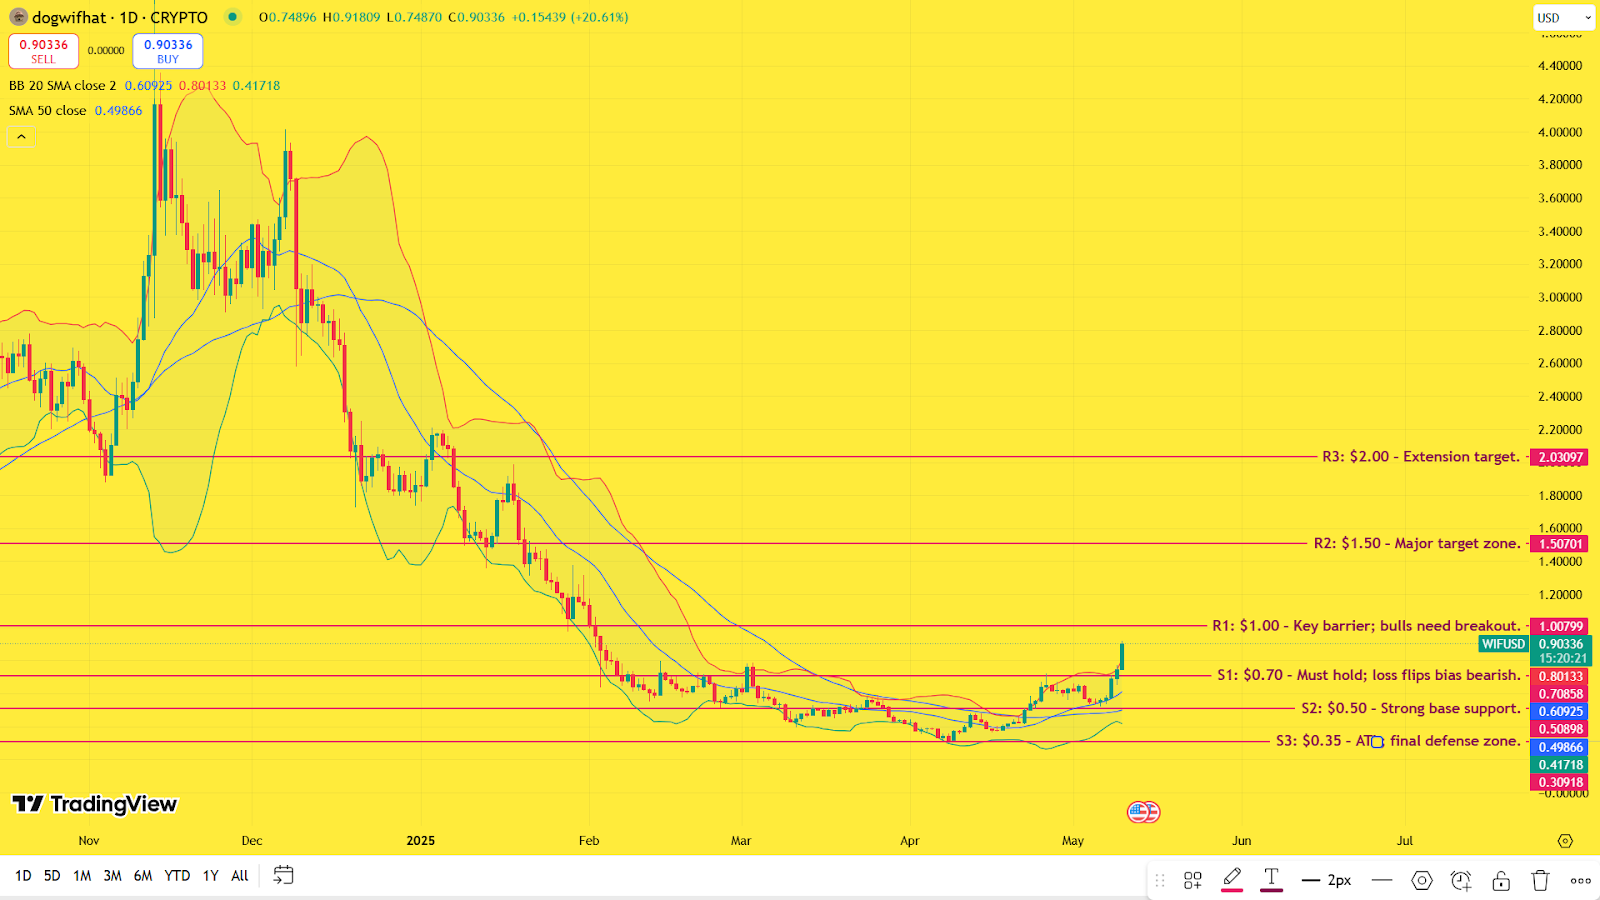
has delivered a sharp 133% rally in the past month, reviving interest after a long period of consolidation. Historically,chart shows the coin skyrocketed to a year high of ~$4.85 in March 2024 but later declined, eventually setting a post-cycle low around $0.35.
From February to early April 2025, theformed a multi-month accumulation zone ($0.35–$0.50), with price action compressed within tight ranges. This was accompanied by flat Bollinger Bands, signalling low volatility and indecision.
broke out of the accumulation phase in early April, pushing above the $0.70 resistance level. This breakout was supported by expanding Bollinger Bands, which confirmed a surge in volatility and renewed trend momentum. The price is now trading above its 50-day SMA, a classic signal of a trend reversal.
The Bollinger Bands continue to widen, with the price hugging the upper band—a hallmark of strong breakout moves.
However, with RSI pushing into the overbought zone (~78), traders should keep an eye on possible short-term consolidation or pullbacks before the next major leg higher.
Open Interest & Volume Surge: Bullish Conviction Strengthens
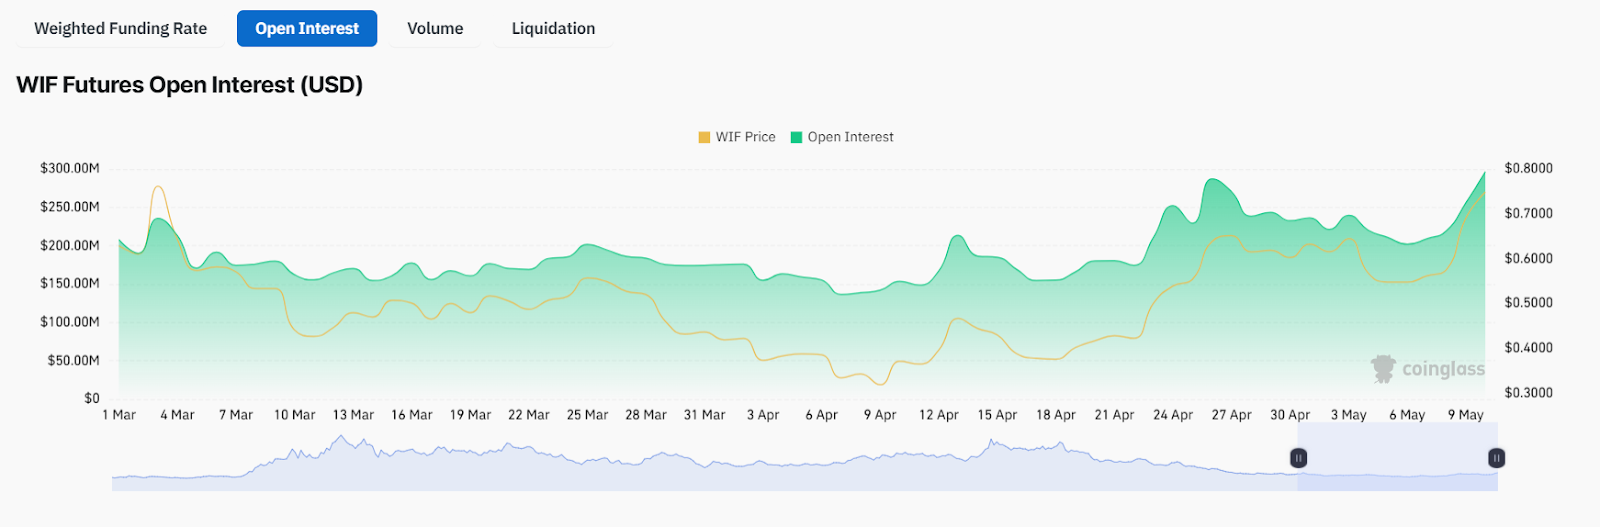
CoinGlass data paints a compelling picture of Dogwifhat’s on-chain strength during its breakout. Theshows WIF futures OI climbing from ~$120M in mid-April to overa +125% jump, confirming increasing Leveraged positions.
Thehighlights that daily trading volume doubled from around $400M in early April to overmatching the price rally and indicating strong market depth.
Theshowed a critical net inflow ofand a significant outflow ofindicating whales and large traders were strategically accumulating and moving tokens out of exchanges—typically a bullish signal showing intent to hold.
WIF Trader Sentiment: Net Buying Trends and Holder Count Indicate Growing Dogwifhat Adoption
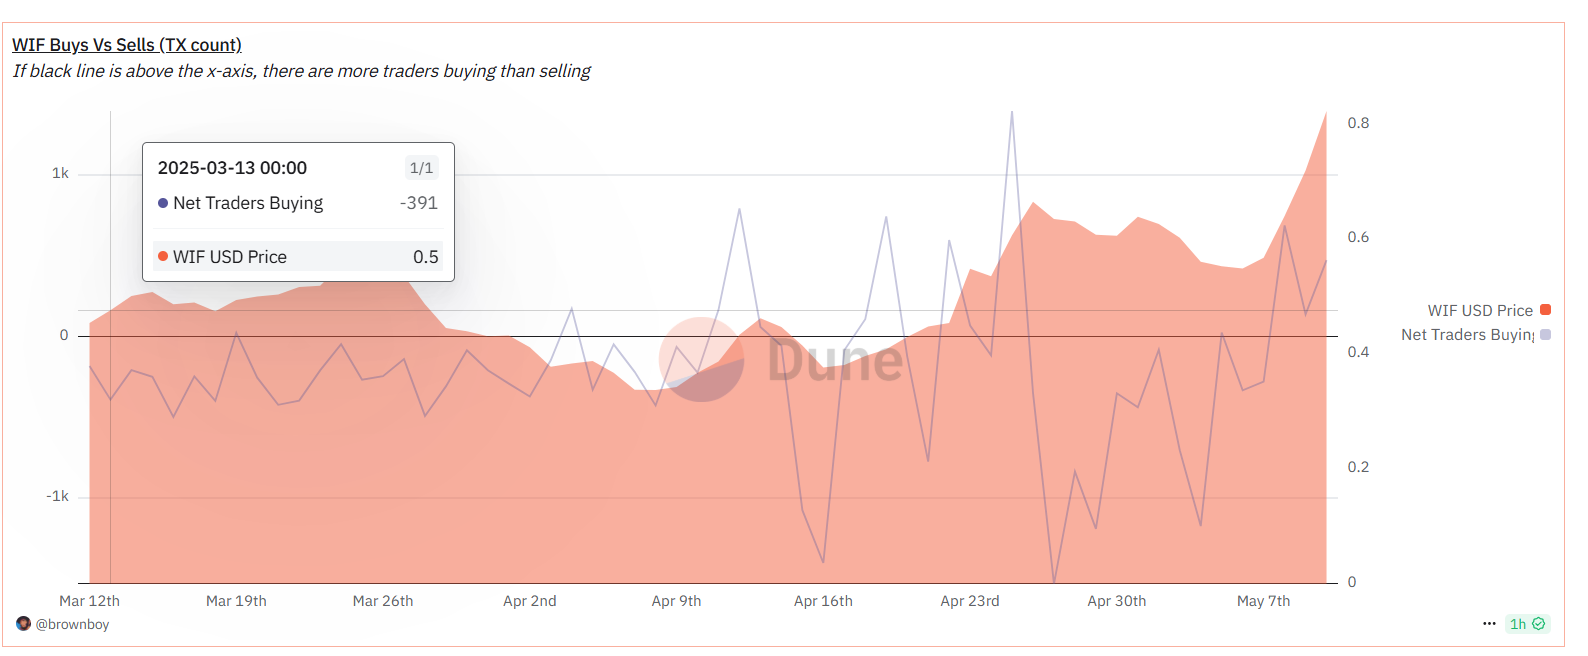
Dune Analytics charts offer further validation of this breakout’s strength. The Buys vs. Sells chart shows that on April 25, 2025, there were 1,397 net buy transactions while the price traded around $0.60, indicating a major wave of accumulation at breakout levels.
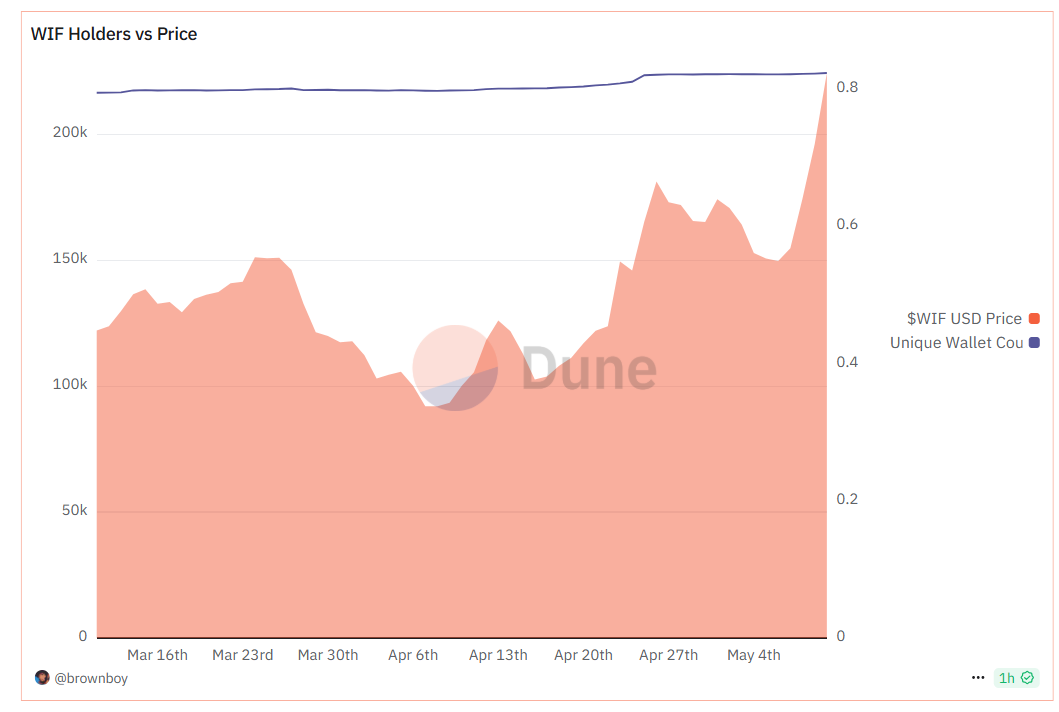
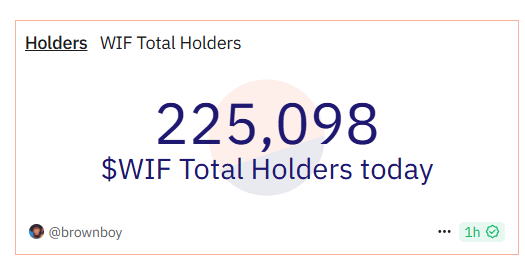
As of May 10, 2025, net buying remained solid with 473 net buys as the price hovered NEAR $0.80, signaling ongoing trader confidence even at higher levels. The WIF Total Holders chart records a rise to 225,098 total holders, and the Holders vs.
Price chart confirms that while WIF price surged in April–May, the number of unique wallets stayed stable and even slightly increased—showing long-term holders are not exiting en masse but staying put, which supports price sustainability.
Is $1.50 Within Reach for WIF?
Dogwifhat’s 133% rally, fueled by a breakout above $0.70 and strong on-chain metrics—Open Interest rising from $120M to $270M and volume doubling—signals solid bullish momentum.
Whale outflows and net buying reinforce accumulation, but RSI (~78) warns of overbought conditions. As long as WIF holds $0.70–$0.85 support, a push toward $1.50 within the next 1–2 weeks remains likely.
Traders should watch for short-term pullbacks near $1.00 before any sustained breakout.
