Cardano’s Price Plunge: Has ADA Fallen Too Far? What the Charts Reveal About Its Next Move

Cardano's price structure is flashing signals that have traders scrambling—has the sell-off gone too far, or is this just the beginning?
Decoding ADA's Technical Blueprint
Forget the hype. The charts don't lie. ADA's recent price action has carved out a pattern that's less about moon-shot dreams and more about cold, hard support and resistance. Key levels have been tested, broken, and retested in a dance that reveals more about crowd psychology than any white paper ever could. The structure suggests a battleground—where the next major move gets decided.
The Bull vs. Bear Tug-of-War
On one side, you've got believers pointing to foundational strength and long-term holding patterns. On the other, skeptics see breakdowns and dwindling momentum. It's a classic standoff, and the price is caught in the middle. Every bounce gets sold, every dip gets bought—until one side finally blinks. The current setup hints that this equilibrium is fragile, primed for a resolution.
What Comes Next for Cardano?
Markets have a funny way of humbling both permabulls and perpetual bears. The next signal will likely come from whether ADA can hold its ground or if it slices through another critical level. Watch for volume—real moves get confirmed with a surge in trading activity, not just hopeful tweets. In the end, price discovers its own truth, often with a side of irony for those who thought they had it all figured out. After all, in crypto, the only 'fundamental analysis' some funds do is checking which way the wind is blowing.
Cardano continues to lag the broader crypto market, trading near $0.36–0.37 after a prolonged decline, while an extended sell-off has kept the price locked inside a descending structure. Despite a modest intraday bounce, ADA remains well below key resistance zones, leaving traders focused on whether this move marks early base-building or just another pause within a broader downtrend. With the demand fading off and the technicals pointing towards a recovery, can the ADA price rise above $0.4?
Current ADA Price Action
At the time of writing, ADA is trading around $0.36, with a market capitalisation of roughly $13–14 billion, keeping it among the top large-cap altcoins.
- 24-hour volume: approximately $250–350 million, modest compared to earlier cycles
- Recent price change: ADA is down around 2–4% on the week, with only shallow rebounds
- Trend context: Price remains range-bound but biased lower, reflecting weak participation from momentum buyers
Volume remains muted, suggesting traders are cautious rather than aggressively positioning.
Short-Term Cardano price AnalysisOn the 4-hour chart, Cardano (ADA) remains trapped inside a descending broadening wedge, reflecting persistent lower highs and controlled selling pressure. Price is currently hovering around $0.36–0.37, after bouncing from the lower boundary of the channel. Presently, the price is attempting to break the resistance, and if it succeeds, a rise from $0.39 to $0.41 could be imminent.
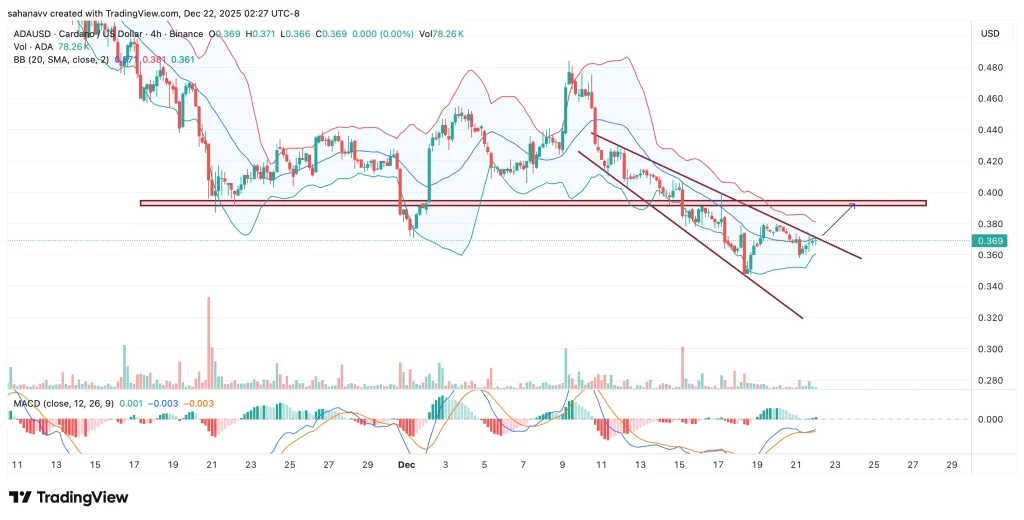
Momentum indicators hint at early stabilisation, but not a confirmed reversal. RSI has lifted modestly from oversold territory, while MACD is attempting a bullish crossover NEAR the zero line. Bollinger Bands have started to compress, suggesting volatility is contracting—often a precursor to a directional move.
For any short-term recovery to gain traction, ADA must break and hold above $0.38–0.40, which aligns with prior horizontal resistance and the channel’s upper boundary. Failure to do so keeps the bias neutral-to-bearish.
Long-Term Cardano Price Analysis
From a weekly perspective, ADA remains firmly in a broader corrective phase. Price continues to trend lower within a well-defined descending parallel channel that has been in place for several months, following the rejection from the $0.80–$1.00 region earlier in the year.
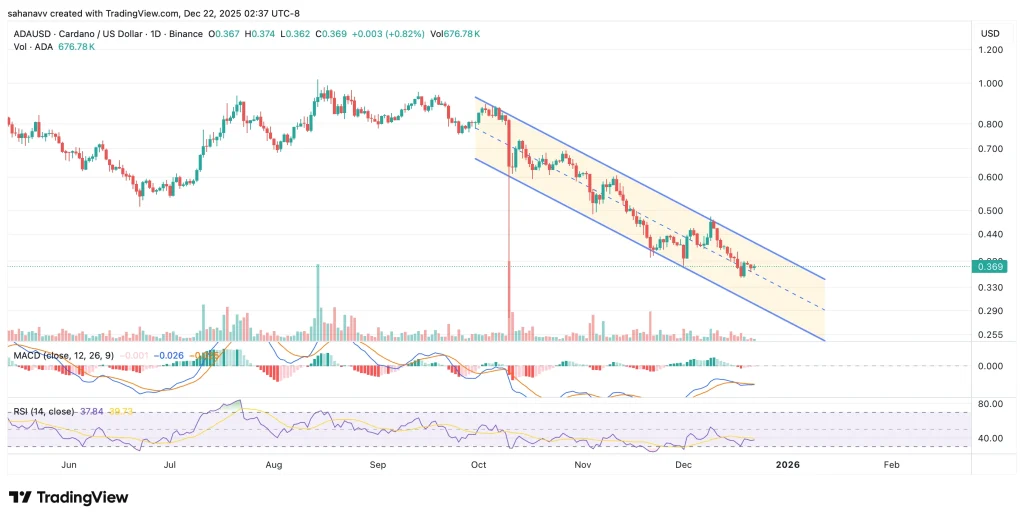
The current price zone near $0.36 sits just above a key long-term demand area, where buyers have previously stepped in to slow declines. However, momentum on the weekly chart remains weak, with MACD still below the signal line and OBV rolling over—indicating limited accumulation so far.
Structurally, ADA needs a weekly close above $0.45–0.50 to signal a meaningful shift in trend. Until that happens, the broader setup suggests consolidation or further downside risk toward the $0.30–0.32 support band remains possible.
Conclusion
The current setup suggests that cardano price can rise above $0.40, but only if buyers show follow-through rather than short-covering. A move above this level would signal that selling pressure is easing and could trigger a relief rally toward higher resistance zones. However, without sustained volume and acceptance above $0.40, any bounce risks fading quickly. Until that confirmation appears, ADA remains in a recovery attempt rather than a confirmed trend reversal, keeping both upside and downside scenarios firmly in play.
