Bitcoin’s Fifth Golden Cross Since 2020 Signals Potential 45% Rally Ahead

A classic bullish signal just flashed on Bitcoin's chart—for only the fifth time since 2020. History suggests it shouldn't be ignored.
What the Golden Cross Actually Means
It's not mystical chart magic. The 'Golden Cross' occurs when a shorter-term moving average—like the 50-day—crosses above a longer-term one, such as the 200-day. This shift signals that recent momentum is overpowering longer-term trends, a textbook indicator of strengthening bullish sentiment. It's the kind of signal that gets technical analysts reaching for the green highlighter.
The Historical Precedent
This is the fifth appearance of this pattern since 2020. The previous four instances weren't mere blips; they preceded significant upward moves. While past performance is the favorite disclaimer of every finance brochure, in crypto's volatile world, repeating patterns are one of the few roadmaps traders have.
The 45% Target: More Than Just a Number
The projected 45% rally isn't plucked from thin air. It's derived from measuring the typical momentum surge following this specific technical conformation. It represents a calculated upside based on the asset's recent volatility profile and the pattern's historical efficacy—a target, not a guarantee. In a market where traditional valuation models often get laughed out of the room, technicians lean on what the chart is actually saying.
A Cynical Nod to Tradition
Meanwhile, in traditional finance, they're still debating whether crypto is an asset class while their own charts look like a flatline EKG. Sometimes, the market's signals are clearer than the regulatory ones.
The setup is there. The signal has fired. Now, the market decides if history will rhyme for a fifth time.

Bitcoin price has been moving sideways around $86K, keeping the crypto market nervous. However, bullish hope has returned as Bitcoin formed a fresh Golden Cross, a signal that often comes before major price rallies.”
According to popular trader Merlijn The Trader, this setup could fuel a 45%–50% move, potentially pushing Bitcoin toward $130K in the coming months.
Bitcoin Golden Cross Appears Again
According to charts shared by crypto trader Merlijn The Trader, bitcoin has formed its fifth Golden Cross since 2020. In past cycles, this signal appeared early, when confidence was low, and many investors were unsure about the market’s next move.
This is why the signal matters. History shows that Bitcoin often moves higher after similar Golden Cross patterns. In earlier cycles, Bitcoin ROSE by:
- 87% in early 2020
- 47% in the next phase
- 78% during the 2021 rally
- 33% in a later cycle
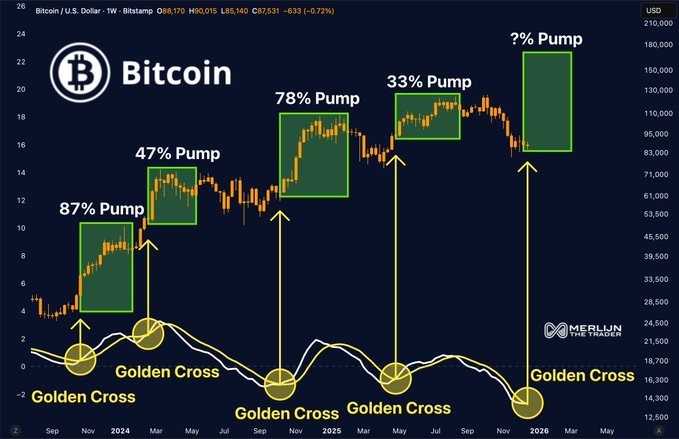
These gains did not happen right away. Bitcoin usually stayed flat for weeks or even months before starting its move. This suggests the Golden Cross often marks the start of a build-up phase, not the top.
How High Can Bitcoin Price Go This Time?
The same situation is visible now. Bitcoin is struggling to MOVE above $90,000, and the overall market mood remains cautious. Merlijn points out that Golden Cross signals usually show up when sentiment is weak, not when excitement is high.
At present, Bitcoin is trading near $86,600. Even the smallest gain of 33% WOULD push the price close to $115,000.
If momentum improves and Bitcoin sees a mid-range rally of around 45%, the price could move toward $130,000. Meanwhile, a similar move this time could lift prices into the $145,000 to $155,000 range.
Bitcoin Price Struggles Short Term
Despite the bullish setup, Bitcoin is still facing short-term pressure. Data from Glassnode shows nearly 6.7 million BTC are currently held at a loss, creating strong selling pressure NEAR the $90,000–$95,000 zone.
At the same time, holiday trading has reduced liquidity, which often leads to sharp but temporary price swings. Recent buying activity has also come mostly from derivatives traders, not long-term spot buyers.
