Solana Sell-Off Cools as SOL Price Defends Critical Support—The Recovery Hinges on This One Level

Solana's bleeding has slowed. After a punishing sell-off, SOL found its footing at a key support zone—traders are now watching a single technical level that could make or break the comeback.
The Bounce Zone
Panic selling finally met a wall of buyers. The defense of this support wasn't graceful, but it was effective, halting the cascade of liquidations that had been feeding on itself. The price action now resembles a fighter leaning on the ropes, catching its breath before the next round.
The Line in the Sand
Forget complex indicators. The entire narrative now revolves around one resistance level. A clean break and hold above it flips the script from damage control to trend reversal. Fail to reclaim it, and this bounce becomes just another dead-cat bounce—a classic pitstop on the way to lower lows. It's the ultimate test of whether this is smart money accumulating or retail getting one last taste of hopium.
Market mechanics are clear: break resistance, invite momentum; reject it, invite despair. All other chatter is just noise for the financial news circus—the kind that calls a 2% dip a 'crisis' and a 3% pump a 'paradigm shift.' The chart has the only vote that matters.
Next move? It's binary. SOL either uses this ledge to launch higher or confirms it was just a temporary handrail on the way down. The market's patience, as always, will be measured in candles, not days.

Solana price is showing early signs of stabilization after weeks of persistent downside pressure, as both on-chain data and technical indicators point to cooling sell momentum. While the broader trend remains under pressure, traders are increasingly watching whether SOL can defend critical support levels and stage a recovery rally heading into year-end.
Solana On-Chain Data Signals Profit-Taking Is Cooling
On-chain metrics by Glassnode suggest that selling pressure may be easing. Solana’s Realized Profit/Loss Ratio, which tracks whether investors are selling tokens at a profit or a loss, has declined sharply after a recent spike. Historically, such cooling phases often mark the end of aggressive distribution periods rather than immediate trend reversals.
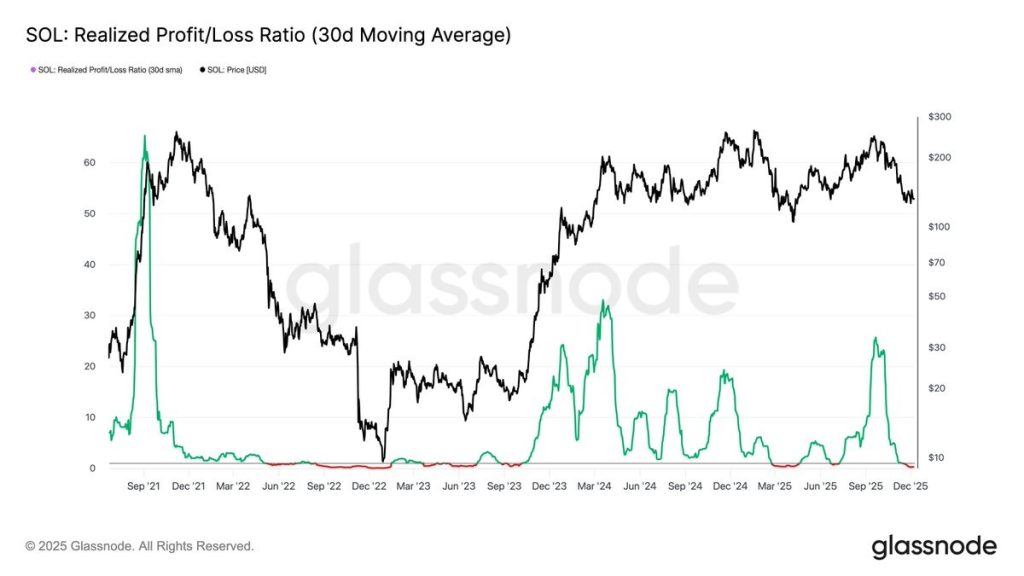
This shift indicates that many traders who bought lower have already locked in gains, reducing near-term sell pressure. While this does not guarantee higher prices, it creates conditions for consolidation, especially if spot demand begins to stabilize.
SOL Price Trades Inside a Descending Channel
From a technical perspective, SOL remains trapped inside a well-defined descending channel that has guided price action since late summer. However, recent price behavior suggests the downtrend is losing momentum.
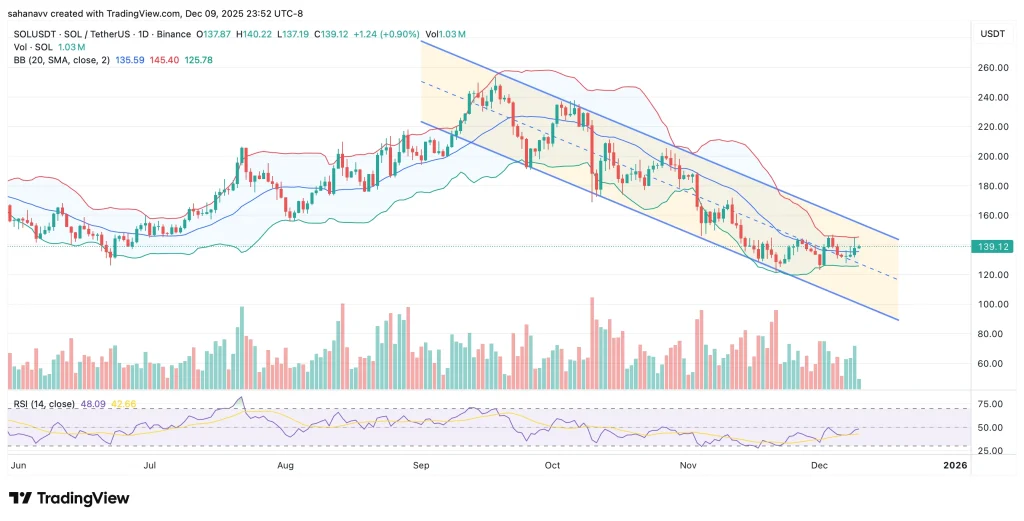
At the time of writing, solana is trading near the $139 level—an area that aligns with the Bollinger Bands and has served as a short-term equilibrium zone in recent weeks. Holding above immediate support at $135 is crucial to prevent a continuation toward the channel’s lower boundary.
RSI and Bollinger Bands Suggest StabilizationMomentum indicators support the idea of a slowdown in selling. The Relative Strength Index (RSI) has rebounded from oversold conditions and currently sits NEAR 48, signaling neutral momentum. This range often precedes directional breakouts, particularly after extended sell-offs.
Meanwhile, Bollinger Bands are beginning to compress, hinting at reduced volatility. Such compression phases often resolve with sharp moves once the price breaks out of its range.
Key Levels That Could Define SOL’s Next Move
For bulls, reclaiming the $145–$150 resistance zone is critical. This region coincides with the upper Bollinger Band and descending channel resistance. A daily close above this area WOULD signal a structural shift and could open the door to a recovery rally toward $155 and potentially $170.
On the downside, failure to hold $135 would weaken the stabilization narrative and expose SOL to a deeper pullback toward the $125 support zone.
Solana Price Outlook: Year-End and Early 2026
Solana’s sell-off appears to be cooling, but the trend has not yet reversed. On-chain data supports reduced selling pressure, while technical indicators suggest the market is transitioning into a consolidation phase. Whether this leads to a recovery rally into early 2026 depends on SOL’s ability to break above key resistance levels in the days ahead.
