Solana’s 30-Day Price Forecast: Bullish Reversal or Impending Fakeout?

Solana stands at a critical technical crossroads—traders are watching for either a decisive breakout or another painful rejection.
The Technical Setup
SOL's chart patterns suggest either a major trend reversal or another bull trap in formation. Key resistance levels loom overhead while support holds—for now.
Market Sentiment Divergence
Retail traders pile into long positions while institutional money remains cautious. The classic 'smart money versus dumb money' dynamic plays out once again—because what's crypto without a little financial Darwinism?
The Catalyst Watch
Network activity metrics and ecosystem developments could provide the fundamental fuel for any sustained move. But in this market, sometimes a single Elon Musk tweet outweighs all the technical analysis combined.
Risk Management Imperative
Traders should prepare for both scenarios—position sizing and stop-losses become non-negotiable when volatility spikes. Because nothing says 'professional trading' like sweating over 30% daily swings while pretending it's all part of the plan.
The crypto market remains volatile as Bitcoin consolidates above the $108,000 mark, while Solana (SOL) emerges as one of the most active altcoins this week. After testing resistance around the $190–$200 zone, traders are now eyeing whether the SOL price can sustain its momentum or face another rejection. With on-chain activity surging and network demand remaining strong, the next 30–60 days could define Solana’s medium-term trend.
Solana (SOL) Price Analysis
Solana’s price action over the past few weeks has shown a mix of strength and hesitation. Currently trading around $180, SOL faces resistance in the $190–$200 zone, which has capped bullish rallies multiple times. On the support side, $165–$170 represents short-term buying interest, while $150 acts as a critical longer-term support level.
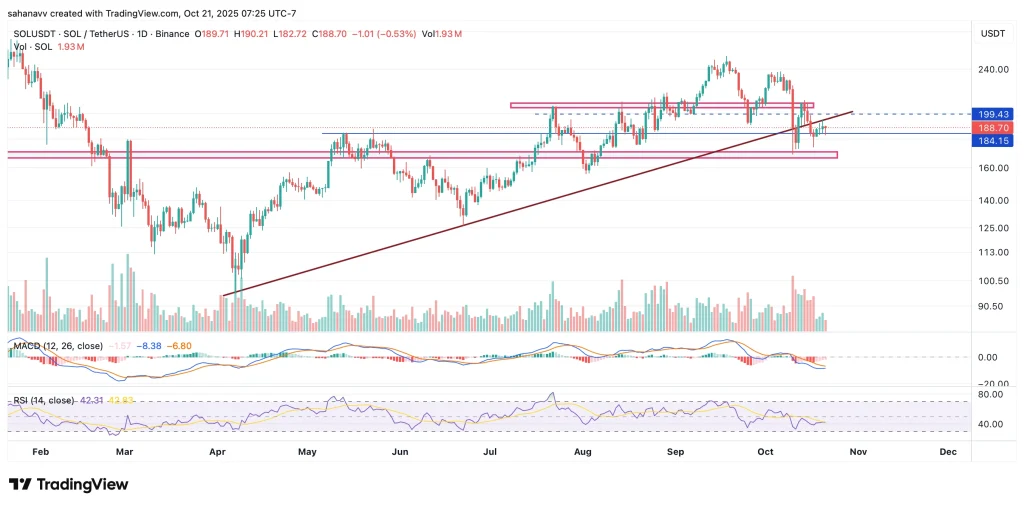
From a technical perspective, the 50-day and 200-day moving averages (MAs) suggest a mid-term uptrend, although price compression below resistance signals indecision. Indicators such as the RSI hovering NEAR 55 and the MACD maintaining a slightly bullish crossover indicate momentum exists, but confirmation is needed. Chaikin Money Flow (CMF) remains mildly positive, reflecting some accumulation by larger holders. Chart patterns suggest a potential ascending triangle, which could lead to a breakout if the $200 barrier is breached.
Bullish Scenario
If solana closes above $200 with strong volume, the next target could be in the $230–$250 range. Momentum indicators like RSI rising above 60 and CMF turning strongly positive would confirm renewed bullish sentiment. On-chain data supports this outlook: Solana’s network continues to see rising transaction volumes, and decentralized exchange (DEX) activity remains robust. Additionally, rising investor interest in Solana-based meme tokens like WIF and BONKindirectly supports demand for SOL itself.
Even in the bullish case, a short-term pullback near resistance is possible, which may act as a healthy consolidation before further upward movement.
Base Scenario
In the base case, Solana may continue consolidating between $165 and $200 over the next 30–60 days. Neutral RSI levels and declining trading volumes suggest indecision among traders. The 50-day MA flattening indicates range-bound conditions, which can precede either a breakout or a breakdown. Such consolidation is typical after recent volatility and allows market participants to digest recent gains.
Traders should monitor BTC movements closely, as Bitcoin’s consolidation or correction often drives altcoin sentiment. Any breakthrough or failure in SOL’s key levels could trigger the next major move.
Bearish Scenario
A breach below $165 could invite stronger selling pressure, potentially pushing SOL toward $140–$150. Indicators to watch include RSI falling below 45 and CMF turning negative, signaling capital outflows and weakening momentum. Key bearish triggers could include a sudden Bitcoin correction, macroeconomic risk-off events, or declining Solana network activity.
Even in this scenario, long-term support at $150 may offer a buying opportunity for investors anticipating a rebound, as network fundamentals remain relatively strong.
On-Chain & Ecosystem Insights
Solana’s network fundamentals continue to impress. Transaction volumes and active addresses are among the highest in the market, showing sustained ecosystem engagement. DeFi activity remains strong, and whale accumulation in wallets holding 10,000+ SOL has been noticeable. The growing popularity of Solana-based meme tokens has also helped drive short-term interest in SOL. These factors combine to provide a solid technical and fundamental foundation for potential bullish scenarios.
As Solana (SOL) price navigates a critical resistance range, traders should monitor volume, RSI strength, and Bitcoin’s movements closely. The coming weeks may decide whether SOL cements a long-term bullish structure or slips back into consolidation. For now, the network’s robust fundamentals and rising investor interest suggest the bulls still have the upper hand—provided Solana breaks the $200 barrier convincingly.
