ASTER Price Alert: Will $1.20 Support Trigger Massive Bullish Reversal?

ASTER teeters on the edge—$1.20 support holds the key to its next major move.
The Critical Level
That $1.20 marker isn't just another number on the chart. It's the battleground where bulls and bears clash—break below and the descent accelerates, hold firm and the rocket fuel ignites.
Technical Setup Screams Opportunity
Volume patterns suggest accumulation near support. RSI flirts with oversold territory while MACD shows early divergence—classic reversal signals if you know where to look.
Market Psychology at Play
Traders watch this level like hawks. Institutional money waits in the shadows, ready to pounce on any confirmed bounce. Retail FOMO could amplify the move once momentum shifts.
Because nothing says 'stable investment' like praying a digital line holds while traditional finance guys sip martinis and short your dreams.

After setting a record high of $2.43 in September, the ASTER price has come under pressure in October amid global market turbulence. On October 10, the mass crypto liquidation drove ASTER to close at $1.20 which is lowest in a month and represents more than half the value lost from top.
Since then, the price has been unable to mount a meaningful recovery, trading just NEAR its key support region. At the time of writing, ASTER price today is around $1.29 with a 0.69% gain in the last 24 hours that suggests consolidation rather than any directional move.
Traders seem to be looking for a a strong directional move as the ASTER crypto market stabilizes from the recent volatility.
Bulls Defend $1.20 as Bears Lose Momentum
On the chart, the $1.20 level has become a key battleground between bulls and bears, currently.
Despite brief intraday dips, this zone has consistently acted as a short-term floor, this is clearly suggesting that buyers have not submitted to bears yet as they are attempting to defend it.
However, the lack of strong momentum still majorly continues to restrict upside attempts, keeping ASTER price USD range-bound for now.
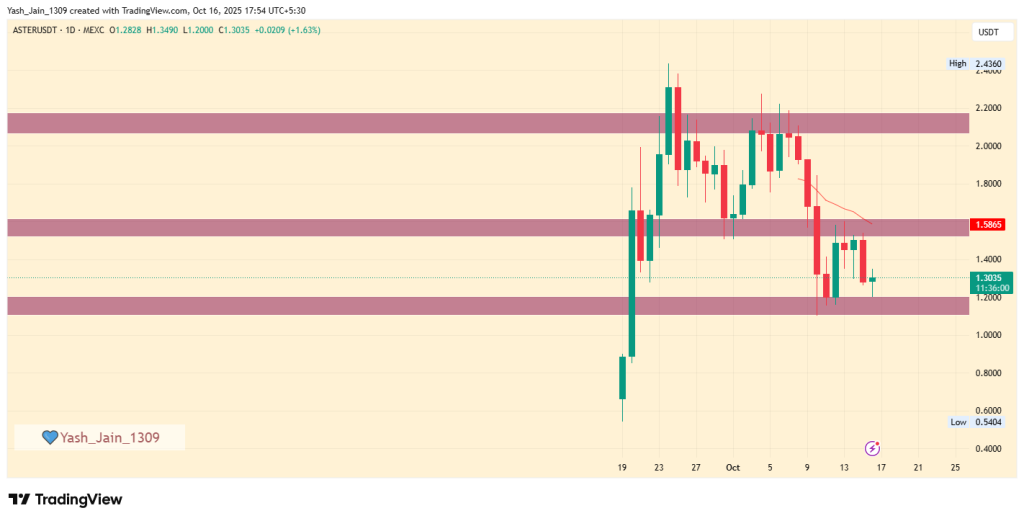
The chart highlights that a move above $1.60 could be the next breakout trigger. As a successful breach of this resistance WOULD confirm renewed bullish strength by the bulls and potentially re-establish ASTER’s uptrend.
On the flip side, failure to hold above $1.20 would invalidate current reversal setups and open the door for deeper declines.
Bullish Gartley Pattern: A Glimmer of Hope
Interestingly, chart patterns reveal a potential Bullish Gartley formation on the ASTER price chart, a rare harmonic pattern recognized for its Fibonacci-based geometry. According to pattern theory, this setup offers a 55-60% probability of achieving its first target near $1.83, provided the structure remains intact.
Now, the validity of this bullish scenario hinges on one critical condition and that is ASTER must maintain its position above $1.26. Analyst is also aligning with our analysis and suggests that any decisive break below $1.20 would mathematically invalidate the pattern and likely trigger renewed selling pressure. This makes the current range an important testing ground for both traders and long-term investors watching for a reversal cue.
$ASTER still has a glimmer of hope of pulling off a Bullish Gartley Reversal; one of the few harmonic patterns that’s mathematically qualified by Fibonacci ratios (usually a rare setup).
Carries roughly a 55–60% probability of reaching Target 1 (~$1.83 / 127.2%) after a… https://t.co/OvrOifNYDp pic.twitter.com/lOuu7GtNTN
Despite the cautious optimism, experts warn that this is not an immediate entry signal. Rather, it represents a potential reversal zone worth monitoring closely in the coming sessions.
