Bitcoin’s Next Support Test: Critical Price Levels Every Trader Must Monitor

Bitcoin faces its ultimate stress test as markets brace for potential downside volatility.
Key Support Zones Revealed
The cryptocurrency's technical structure reveals several crucial demand zones that could determine its near-term trajectory. These levels represent make-or-break territory for bulls attempting to defend the current price structure.
Market Psychology at Breaking Point
Traders watch these thresholds like hawks—each breach potentially triggering cascading liquidations while bounces could spark short squeezes. The entire digital asset ecosystem holds its breath as Bitcoin approaches these technical inflection points.
Institutional players quietly accumulate at perceived bottoms while retail panic sells—the age-old Wall Street dance now plays out with blockchain transparency. Sometimes the most sophisticated trading strategies boil down to buying when others are fearful, even if that fear appears justified.
Will support hold or collapse? The market's about to vote with its wallet.

Bitcoin’s price action is capturing traders’ attention after dropping below the crucial $112,000 mark. This has led to the burning question: how low can Bitcoin go? So, giving a brief overview, in the past 24 hours, BTC price slipped 0.56% to $111,872.56, extending a week-long slide. Growing volatility, heavy liquidations, and macroeconomic jitters have put downside pressure on prices. Let’s dig into the technical triggers, market sentiment, and the levels every trader should watch.
BTC Price Analysis:
Bitcoin price broke a series of technical defenses in rapid succession. That being said, the 7-day SMA at $114,563, pivot point at $112,848, and the Fibonacci 38.2% retracement at $113,847 all failed to hold as support. This breakdown accelerated sell-offs as algorithmic traders triggered stop-losses just below $113,000, leading to a cascade that dragged BTC into the low $111,000s.
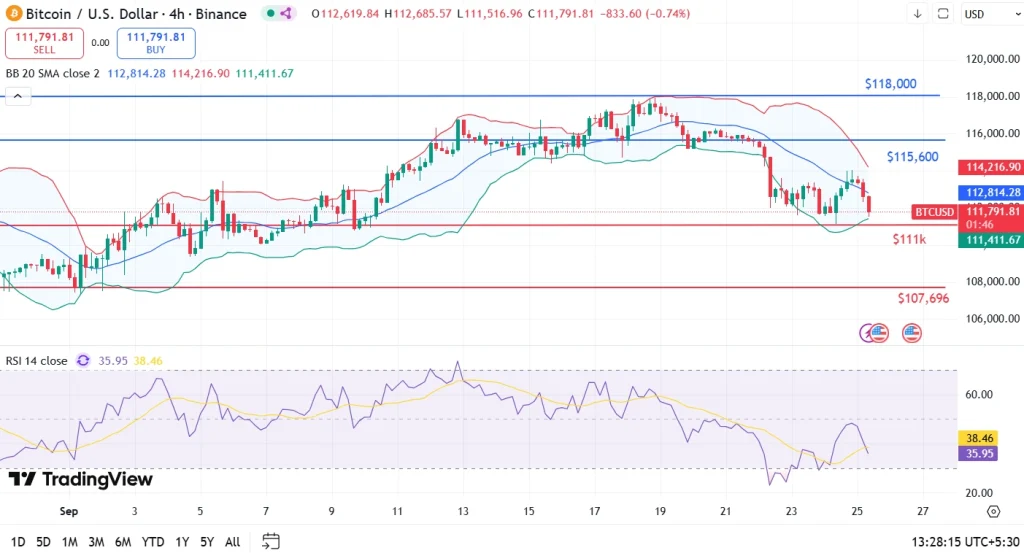
Volume has spiked 3.51% in the last 24 hours to $50.7 billion, signaling heightened activity. RSI at 35.95 suggests that there is no clear oversold bounce in sight. Funding rates have slipped into mildly negative territory, discouraging aggressive new longs and hinting caution among Leveraged bulls.
Key Levels to Watch
Given these conditions, the next immediate support rests at $111,000, followed by a key zone in the $107,000–$108,000 range. If panic selling intensifies, BTC price could test the 200-day EMA NEAR $103,868, a level we view as the line in the sand. Any bounce is likely to face resistance at $113,000–$114,000, the zone that recently flipped from support to overhead pressure.
What Led To Bitcoin Price Drop?
Several factors have pushed Bitcoin lower. The most immediate driver was the $1.7 billion in long liquidations, which set off a chain reaction of forced selling and stop-loss triggers. Moreover, Fed Chair Jerome Powell reaffirmed a restrictive stance on monetary policy, weighing on risk assets across the board.
At the same time, President Trump’s renewed tariff threats stirred geopolitical uncertainty, tightening Bitcoin’s correlation with equities. Taken together, these catalysts have created an environment where traders are hesitant to step in aggressively, leaving bitcoin vulnerable to further downside.
FAQs
Why is Bitcoin price dropping so fast this week?Bitcoin’s decline stems from technical breakdowns at multiple levels and a record $1.7 billion in long liquidations, making the sell-off sharper and faster.
What are the next support levels to watch?Immediate support is at $111,000. Below that, the $107,000–$108,000 zone may attract buyers. The 200-day EMA at $103,868 is a crucial technical barrier.
