Bitcoin Teeters on the Edge: BTC Price Shatters Key Bullish Trendline – What’s Next?

Bitcoin's armor cracks as bears breach a critical support trendline that's held since the 2024 halving. The $63,000 level—once a springboard for rallies—now flips into resistance. Traders scramble as liquidation cascades erase $200M in long positions within hours.
Market psychology shifts from 'buy the dip' to 'wait and see.' Analysts point to macroeconomic headwinds: Fed rate hike whispers and a stronger dollar squeezing risk assets. 'Crypto's hedge narrative is being stress-tested,' quips a Wall Street skeptic—between sips of his $8 artisanal coffee.
Technical outlook turns murky below the 200-day moving average. Bulls need a swift reclaim of $65k to prevent a deeper slide toward $58k. Meanwhile, Bitcoin maximalists dust off their 'number go up' memes while altcoin traders quietly rotate into ETH and SOL.
Next 48 hours critical. Either we get the mother of all bull traps—or confirmation that this cycle's greed phase has peaked. Watch the futures basis and ETF flows like a hawk. After all, in crypto, 'technical analysis' is just astrology for MBAs.
Bullish momentum fading
The weekly chart (candlestick format) shows that BTC's ongoing decline follows repeated bull failure to secure a foothold above $122,056, the Fibonacci golden ratio. It also marked the inability to keep gains above the significant long-term resistance trendline that connects the bull market highs of 2017 and 2021.
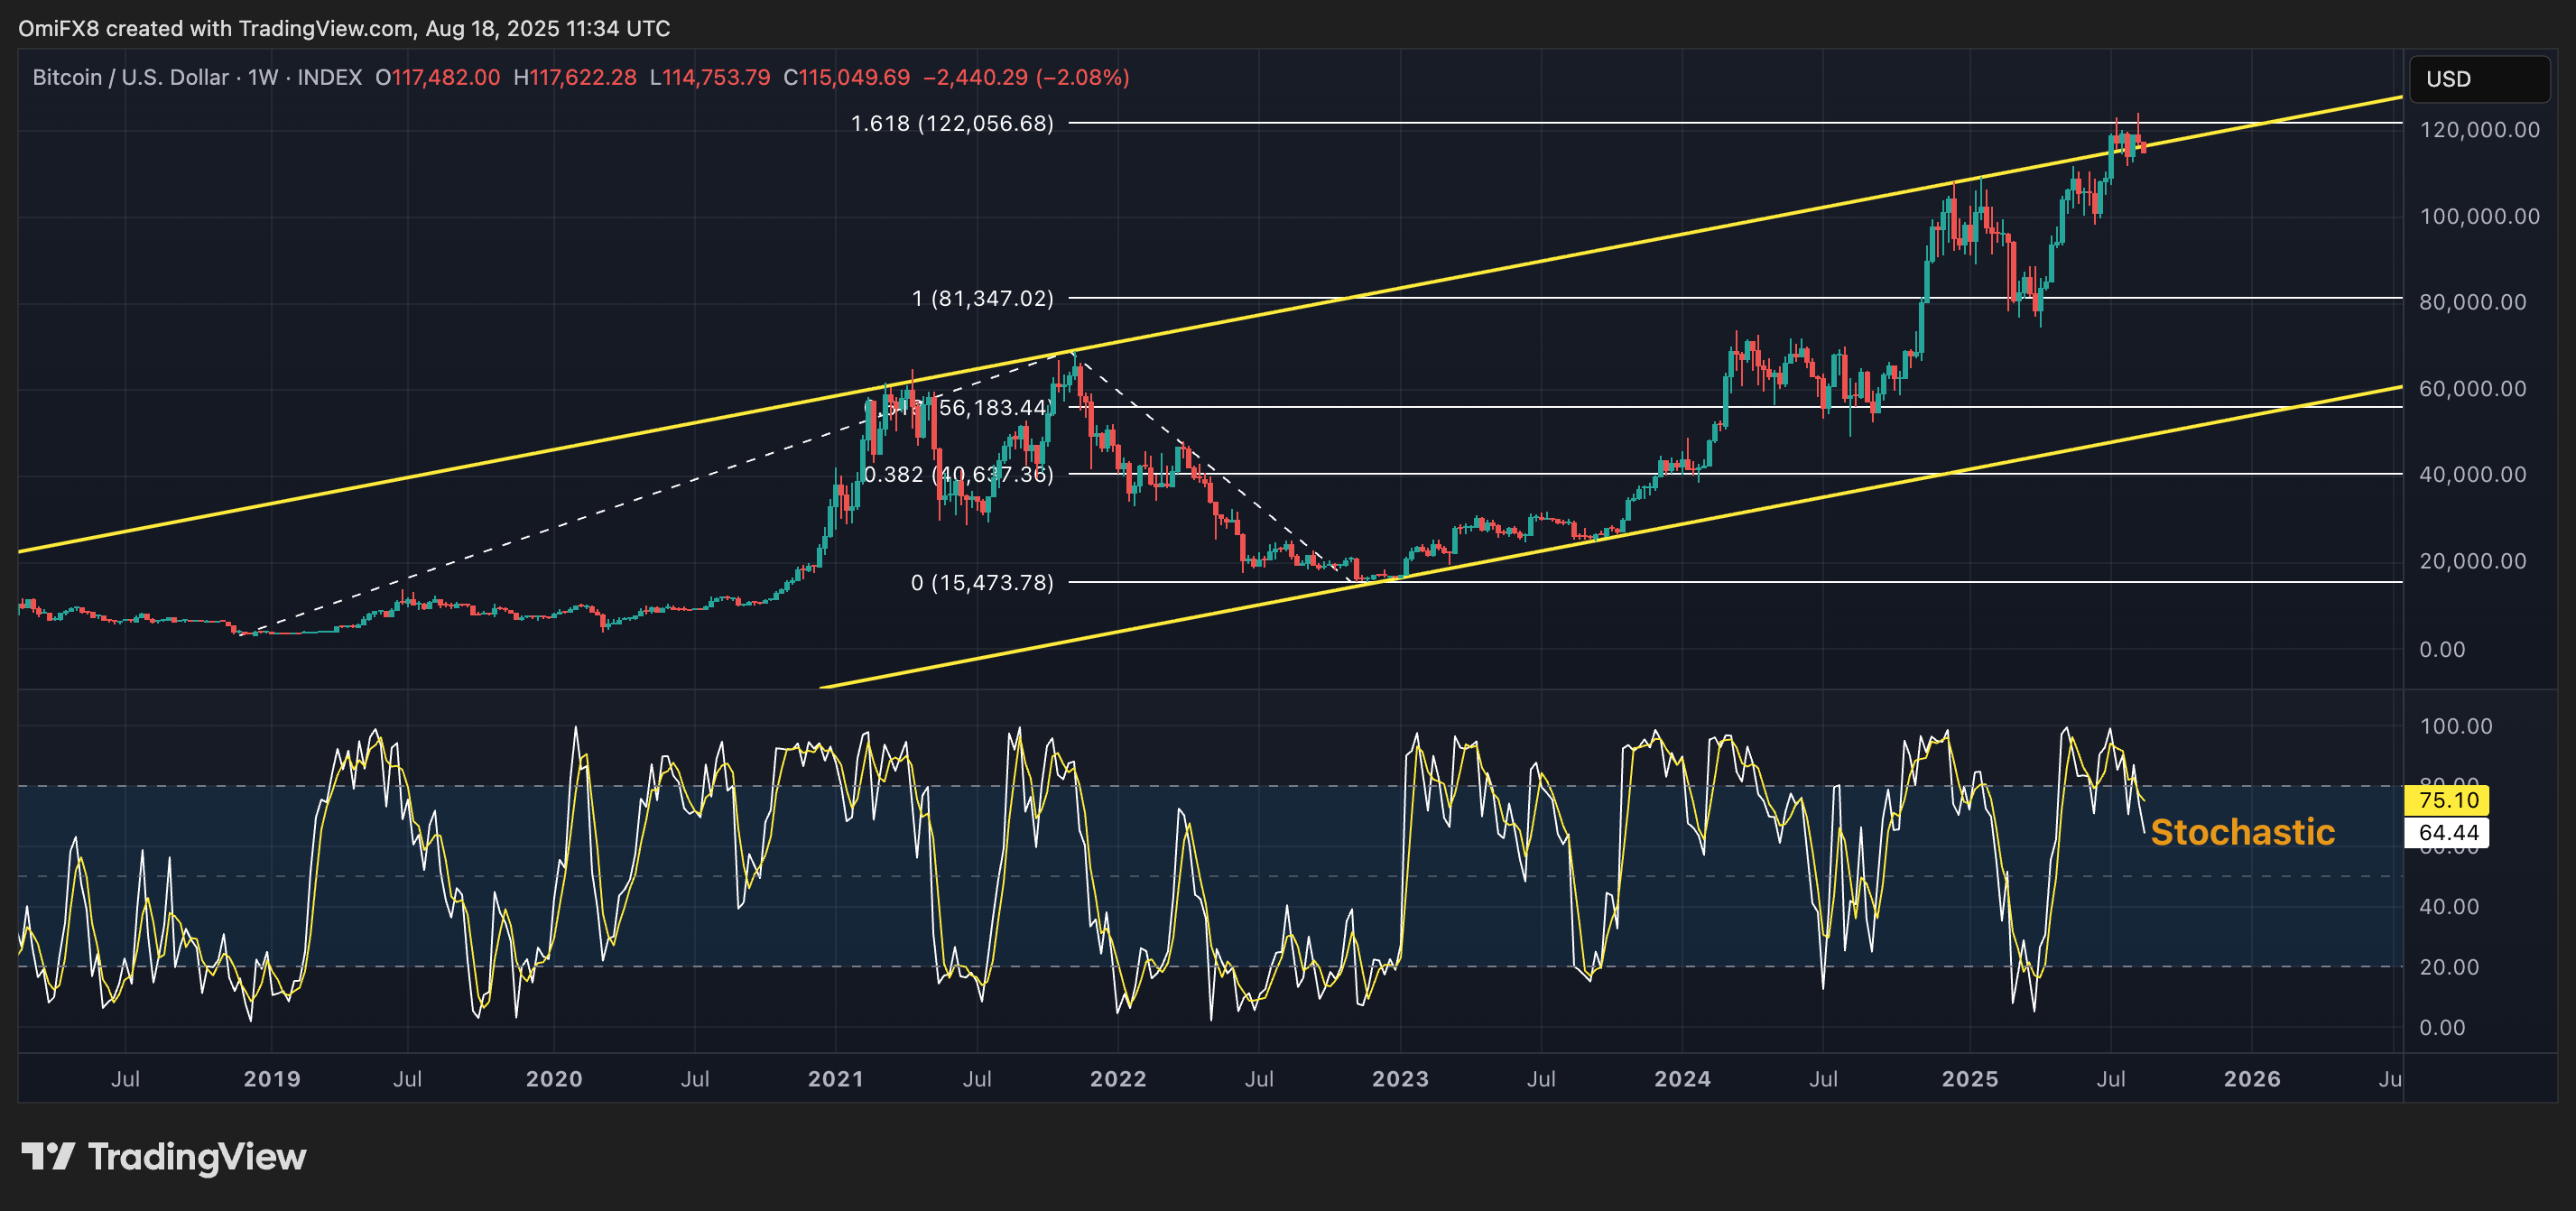
Additionally, the weekly stochastic oscillator has rolled over from the overbought zone above 80, signaling a potential correction ahead.
Daily chart
On the daily chart, BTC’s latest candle has broken below the bullish trendline extending from April lows, following Friday’s bearish outside-day candle that signaled a potential shift toward seller dominance.
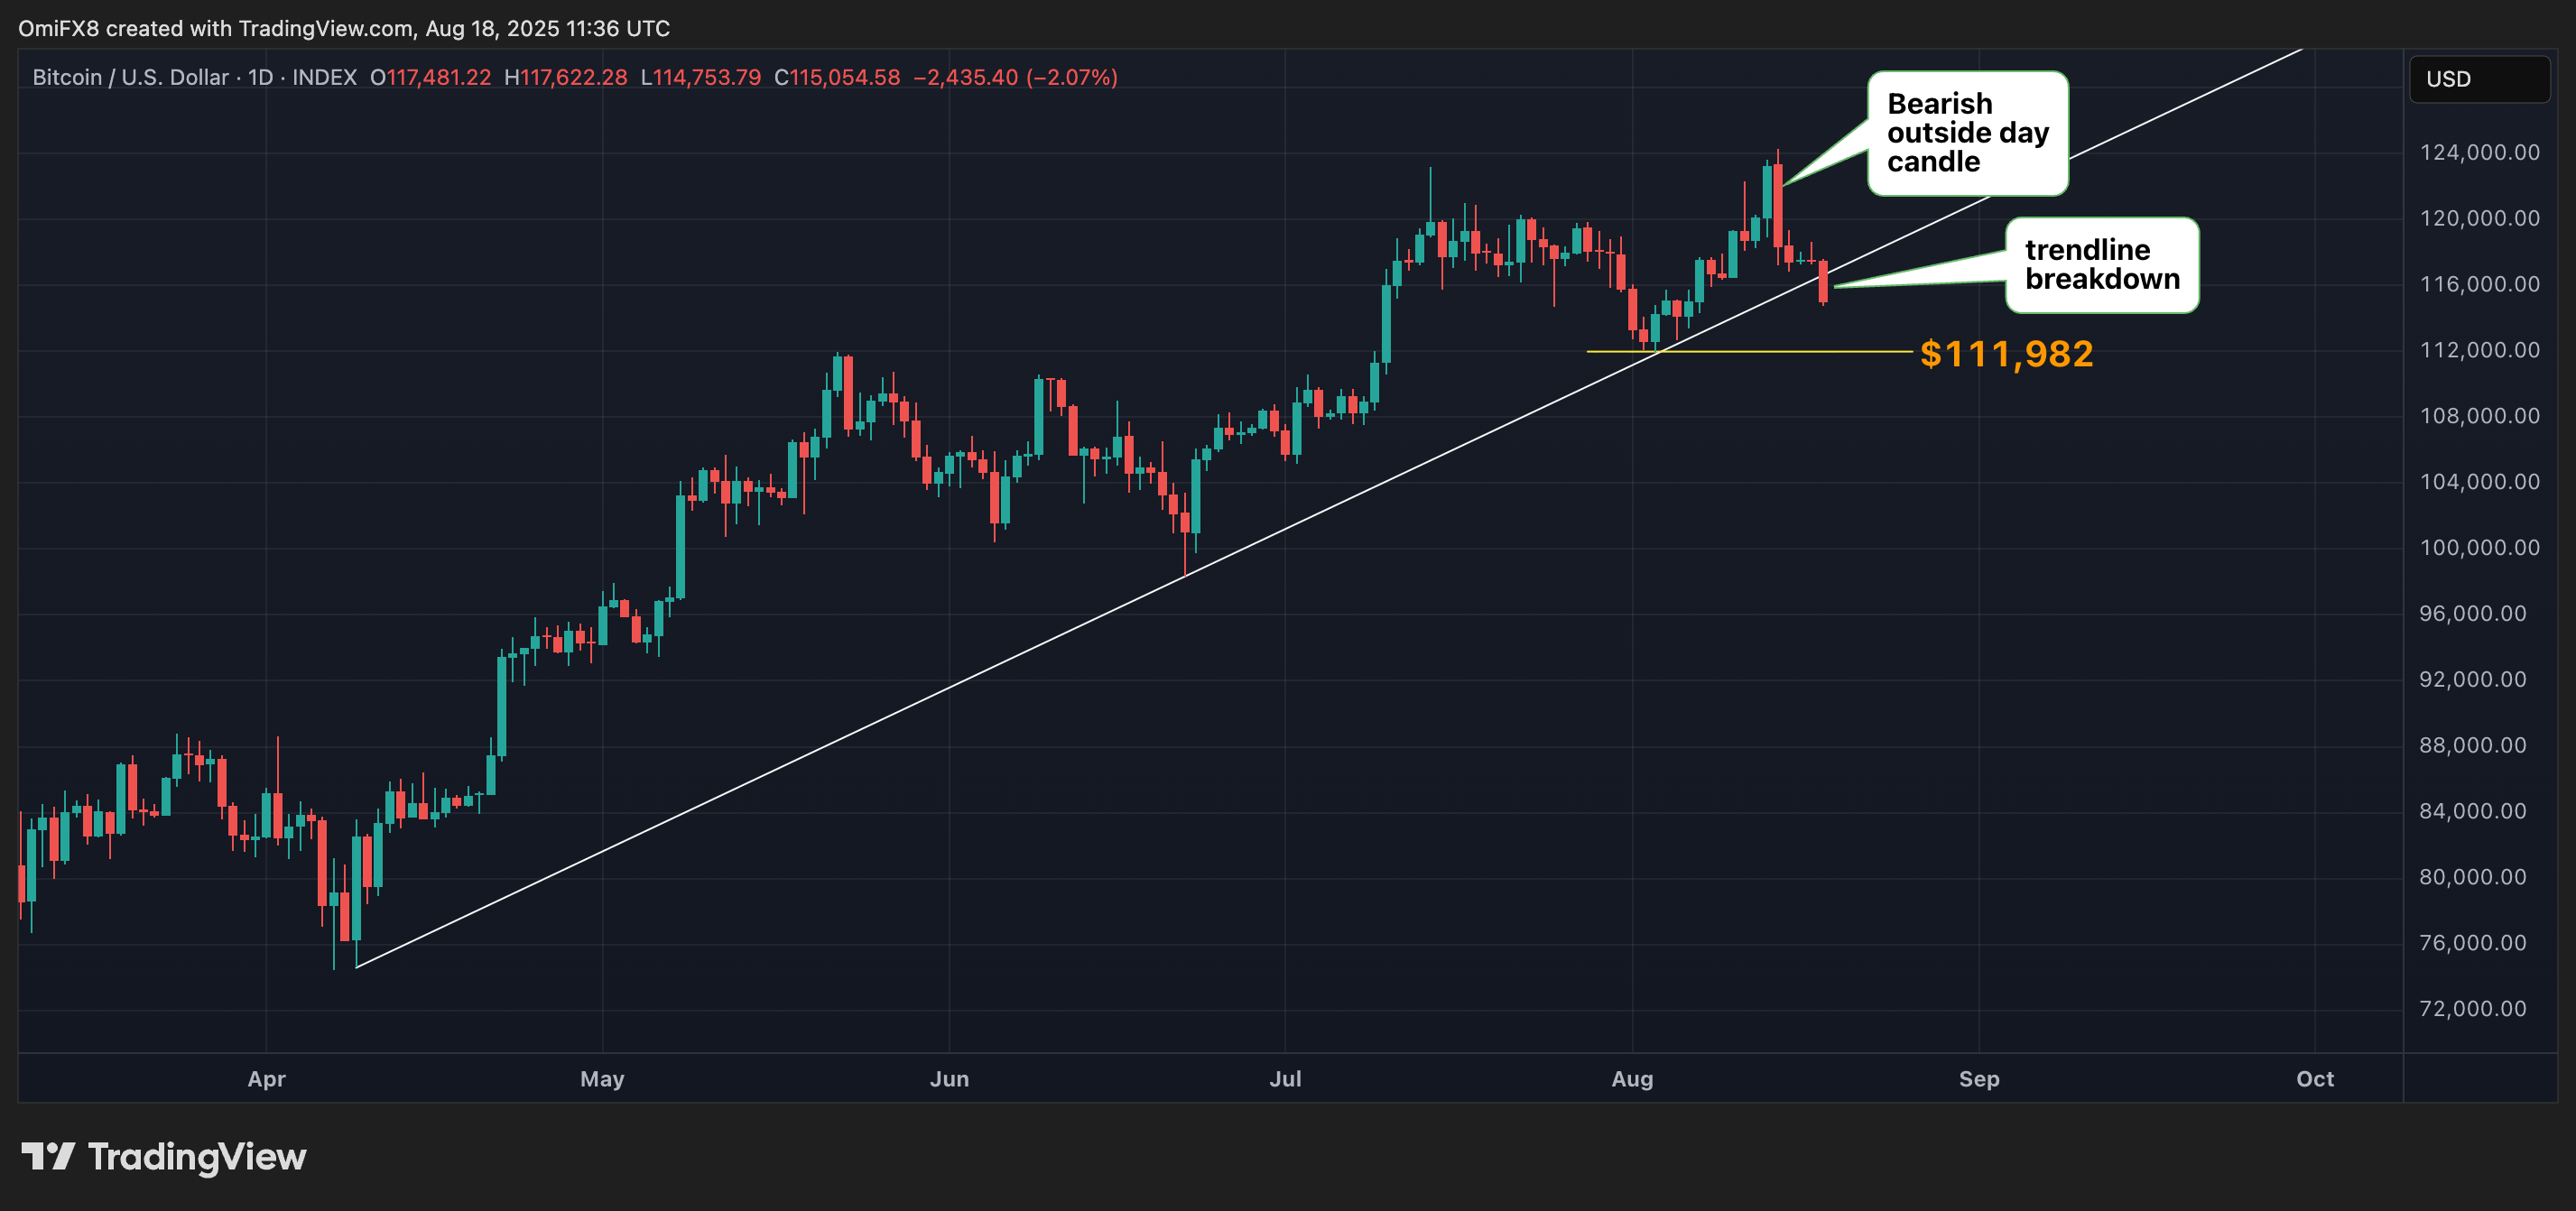
Together, these technical signals indicate an increasing downside risk for BTC in the near term, with a potential retest of $11,982, the point from which the market turned higher on Aug. 3. A violation of this level WOULD shift focus tothe 200-day simple moving average at around $100,000.
A potential reversal higher to above $118,600 (Sunday's high) during the day ahead would weaken the bear case.
- Resistance: $120,000, $122,056, $124,429.
- Support: $111,982, $105,295 (the 31.8% Fib retracement of April-August rally), $100,000.
