XRP Charts Flash Warning Signs for Bulls While Bitcoin Holds Breath for Breakout—Ether Goes Wild

XRP's technicals are throwing red flags—just as Bitcoin teeters on the edge of a decisive move. Meanwhile, Ethereum’s price action is… well, unhinged.
Here’s the breakdown:
XRP: Bulls on Thin Ice
Key support levels are cracking. If they fail, it’s a long drop down—traders scrambling for exits.
Bitcoin: The Waiting Game
Consolidation tightens like a spring. Breakout or breakdown? Markets hold their breath.
Ethereum: Chaos Mode Activated
Wild swings, liquidations galore. Some call it volatility—others call it institutional money playing whack-a-mole with retail.
Bonus jab: Traders still pretending TA matters when a single Elon tweet can vaporize resistance levels. Classic crypto.
XRP: Not out of the woods yet
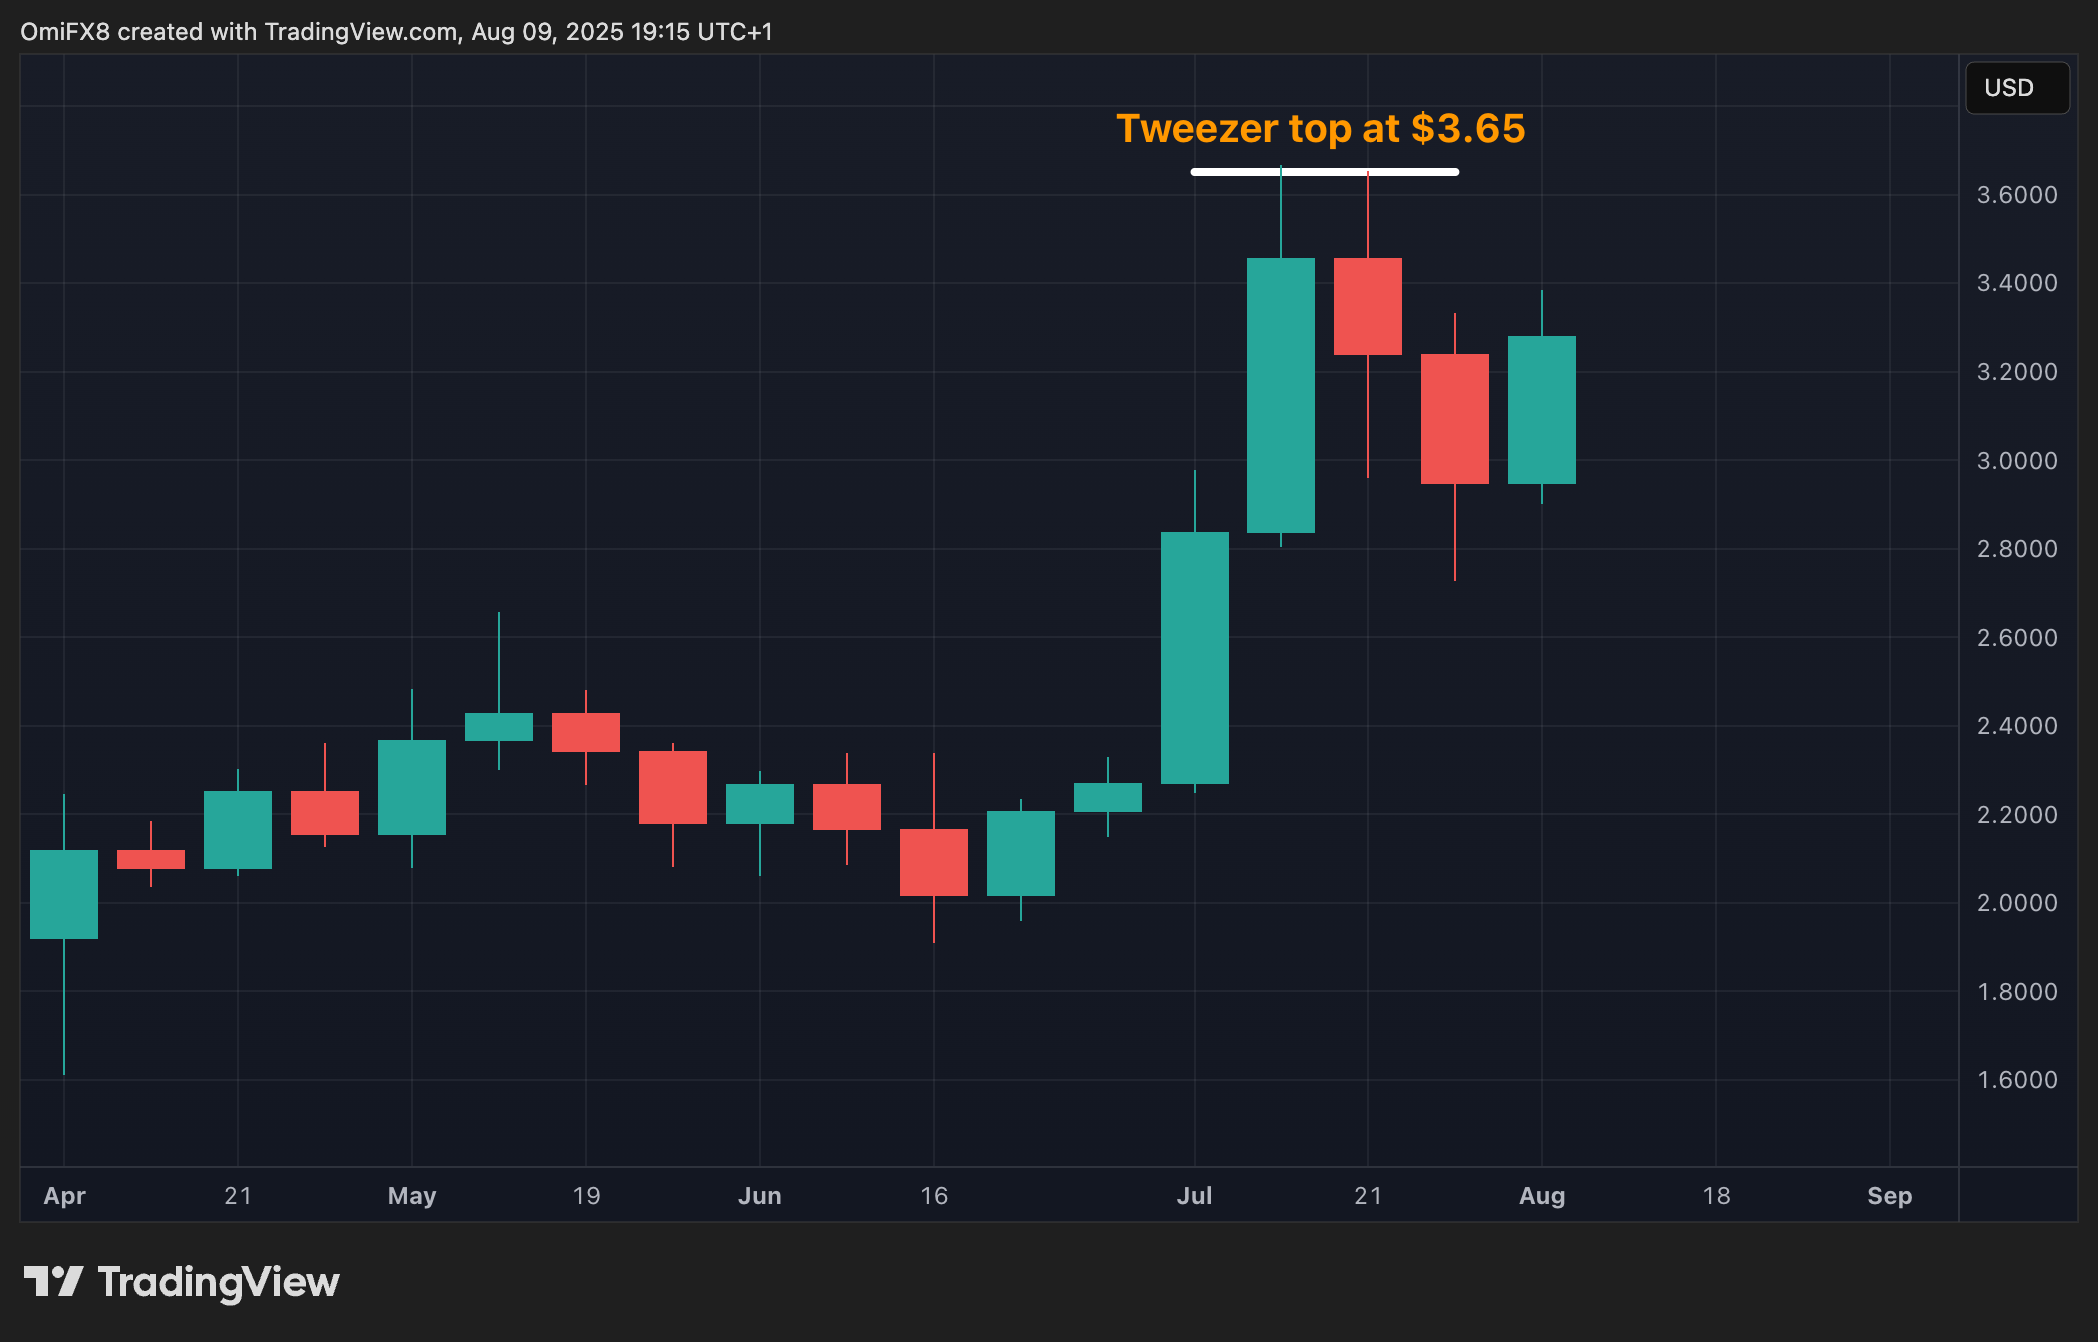
XRP (XRP), the payments-focused cryptocurrency, surged 11% on Thursday, reportedly breaking out of a bull flag pattern to suggest renewed upward momentum. However, it's not yet clear, as prices remain well below the crucial $3.65 level, where a bearish "tweezer top" candlestick pattern occurred last month.
The tweezer top is a bearish reversal pattern, comprising two candles with identical highs that represent a clear rejection point, in this case $3.65. It's as if the market tried to climb to a new level twice and was met with a brick wall of selling pressure at the same spot, a sign that the upward momentum has completely stalled.
The bulls, therefore, need to overcome the significant supply point at $3.65, a move that WOULD invalidate the bearish reversal pattern.
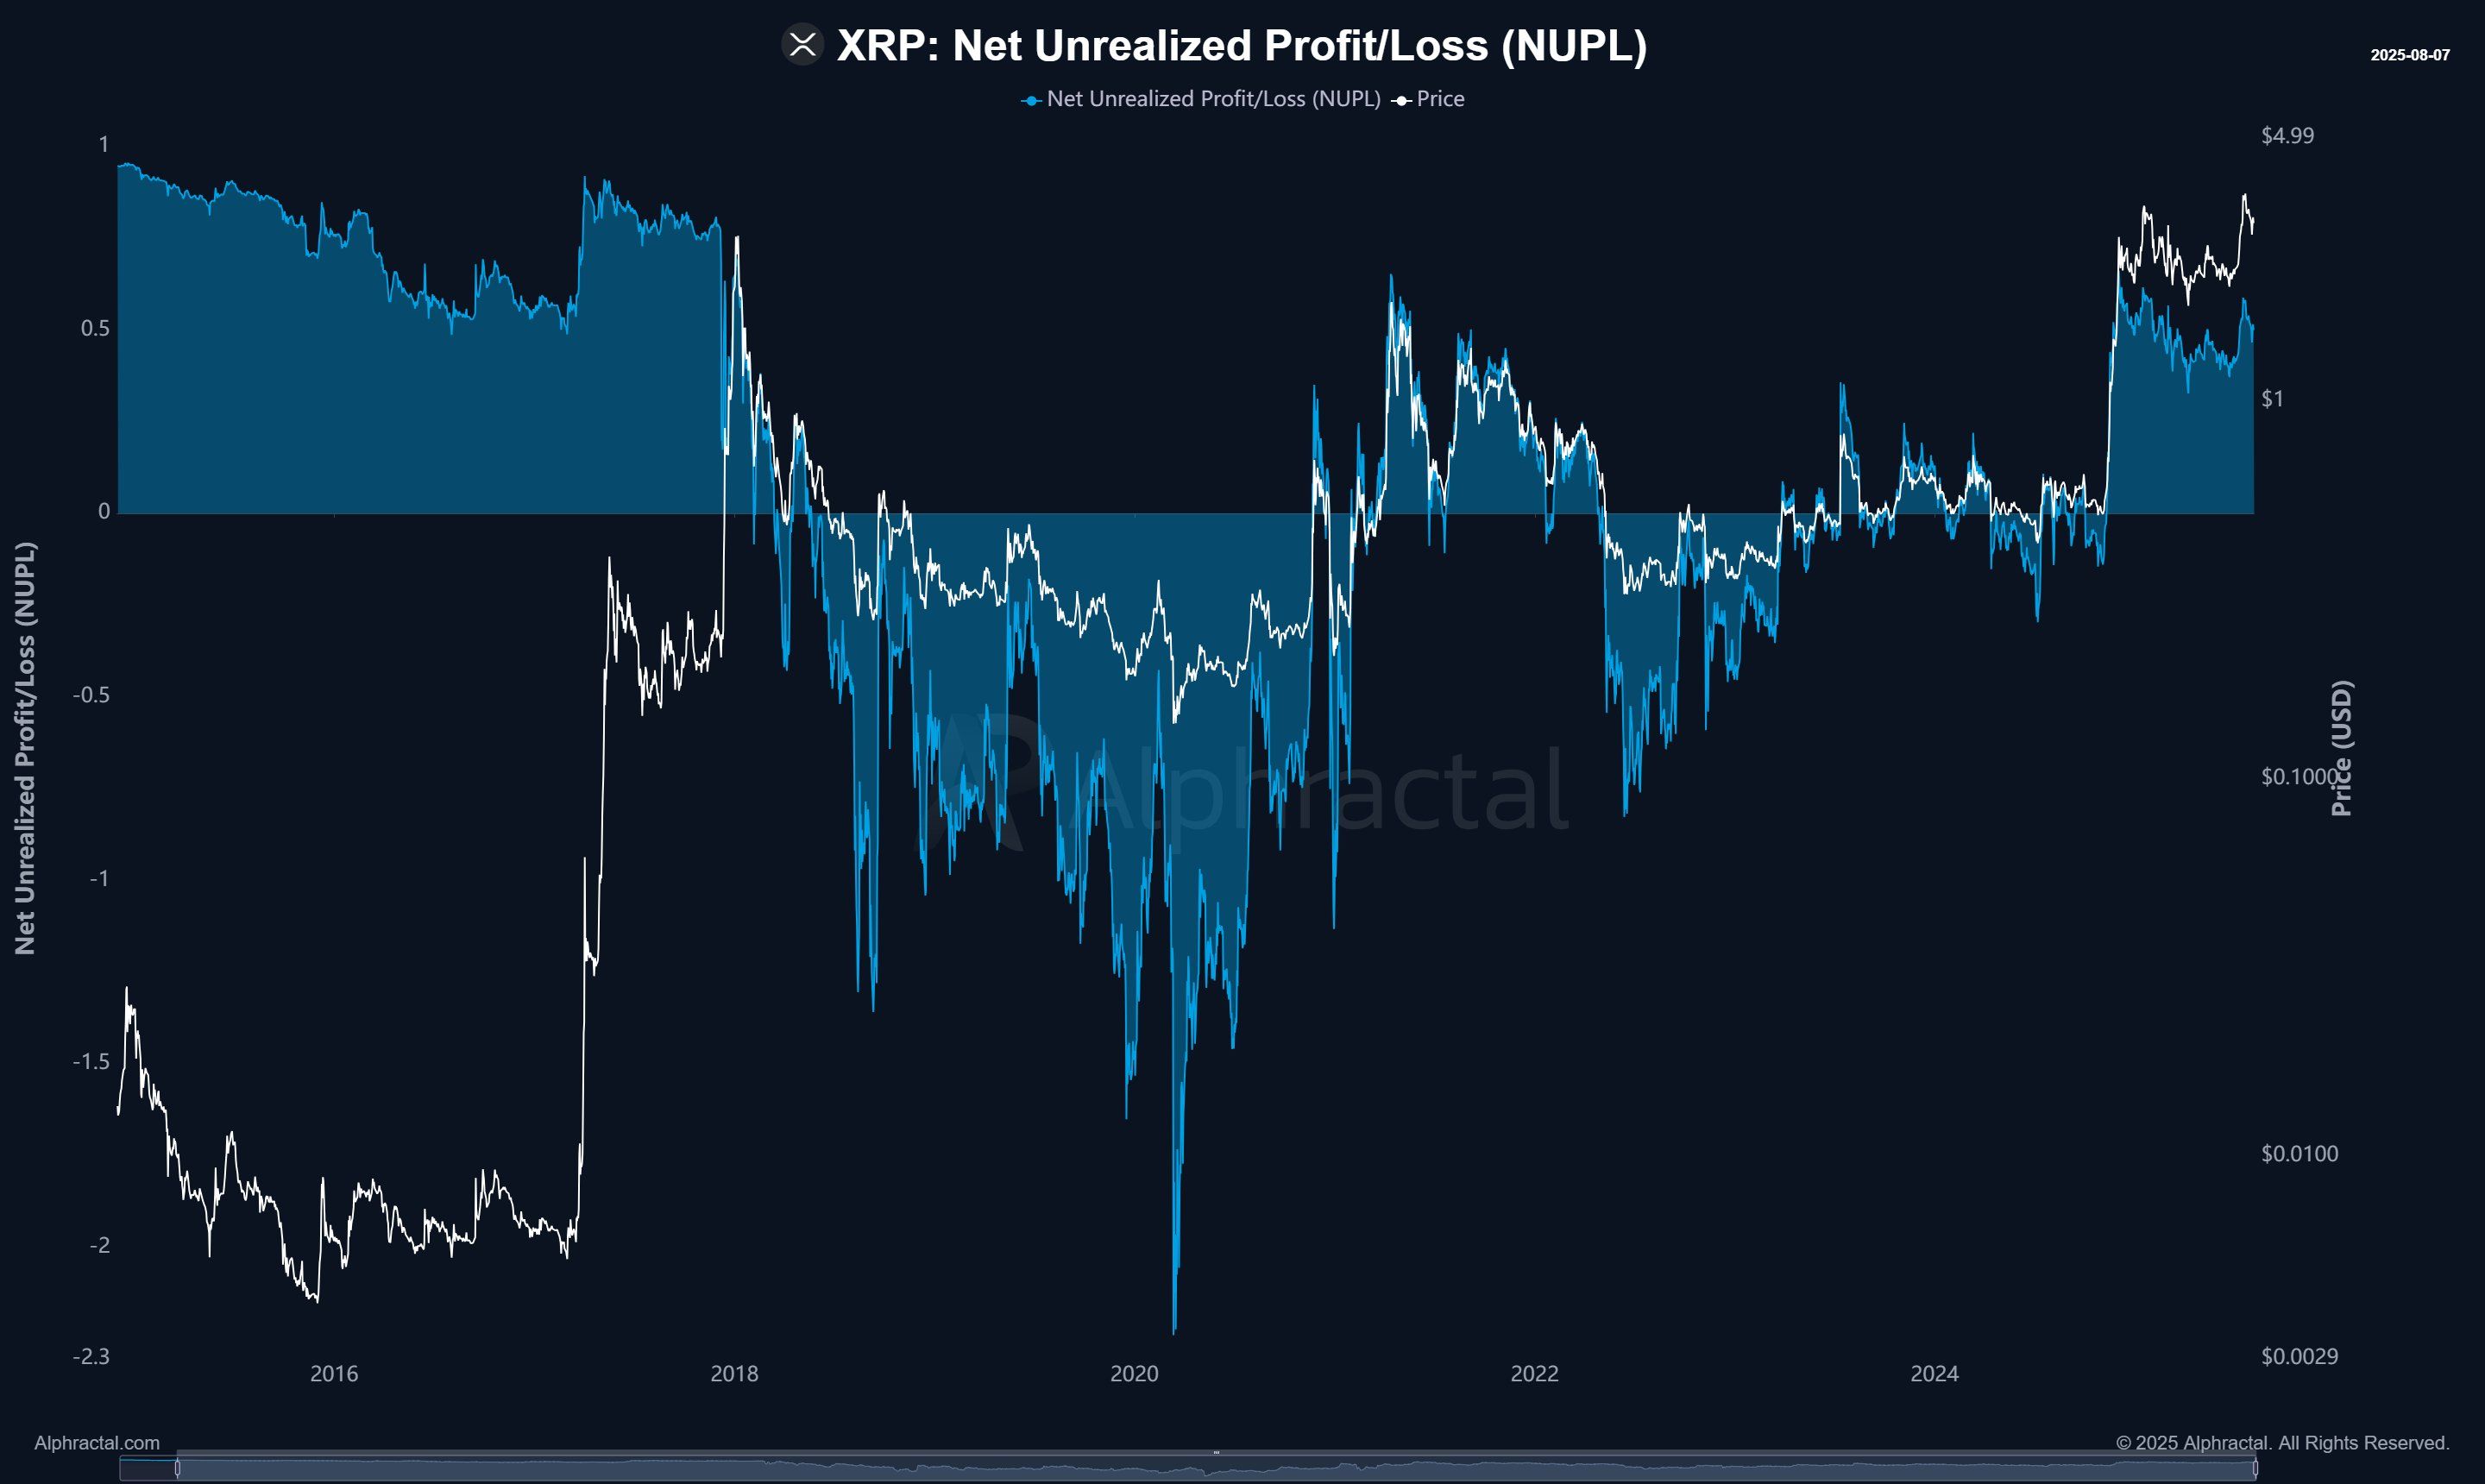
However, this may be easier said than done, as on-chain data suggests that holders are sitting on substantial profits and have a strong incentive to sell at current valuations.
"The [XRP] Net Unrealized Profit/Loss (NUPL) remains at elevated levels not seen since the 2021 peak, reaching similar levels to those observed in 2018. These high values indicate that the market still carries significant unrealized profits, which historically represents zones of potential distribution and price correction," research firm Alphractal said on x.
- Resistance: $3.38, $3.65, $4.00.
- Support: $2.99, $2.72, $2.65.
Bitcoin: BTC awaits breakout
Bitcoin's (BTC) recent pullback is currently taking the shape of a descending channel (white lines) within its primary uptrend (yellow lines). This pattern is a classic "bull breather" that suggests the market is consolidating its recent gains.
The price's recent bounce from the 50-day Simple Moving Average (SMA) further reinforces the strength of this consolidation. For traders, this means that while the short-term trend is still corrective, the path of least resistance remains to the upside.
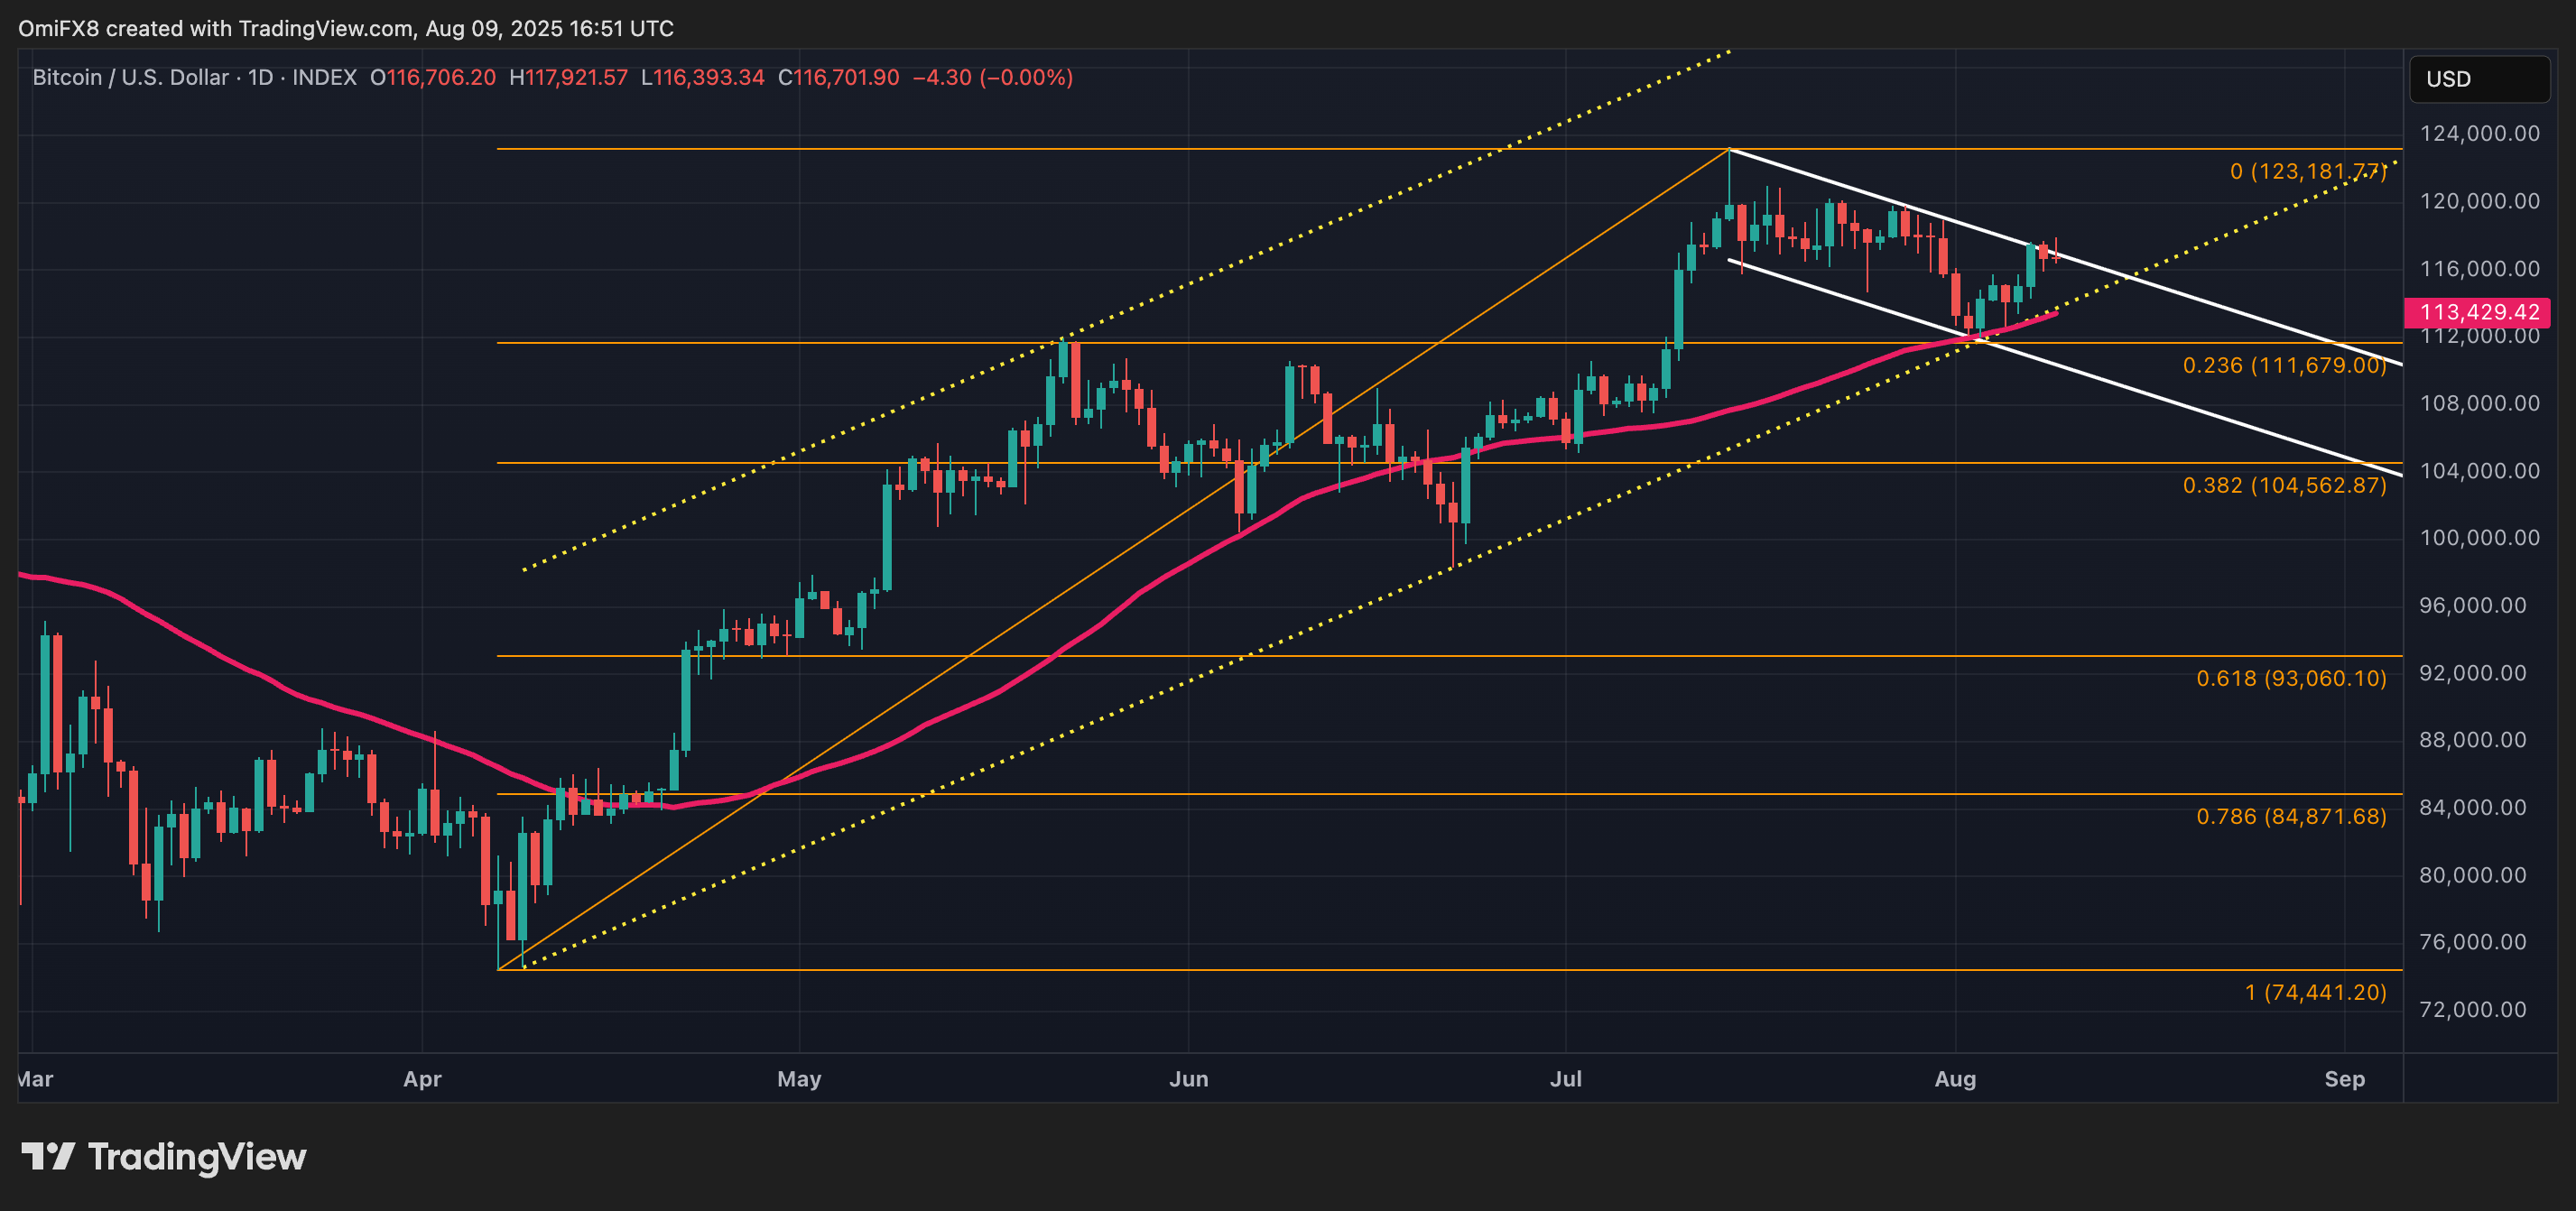
A decisive breakout from the descending channel would confirm a continuation of the broader uptrend, potentially yielding a MOVE to record highs above $123,000. Conversely, a move below the May high of $111,965 would increase the risk of a deeper sell-off to $100,000.
- Resistance: $120,000, $122,056, $123,181.
- Support: $111,965, $104,562, $100,000.
Ether: Major breakout
Ether has rallied to over $4,200, reaching levels last seen four years ago. The cryptocurrency has broken out of a prolonged symmetrical triangle that contained its price since the all-time high in late 2021, which is a major bullish signal.
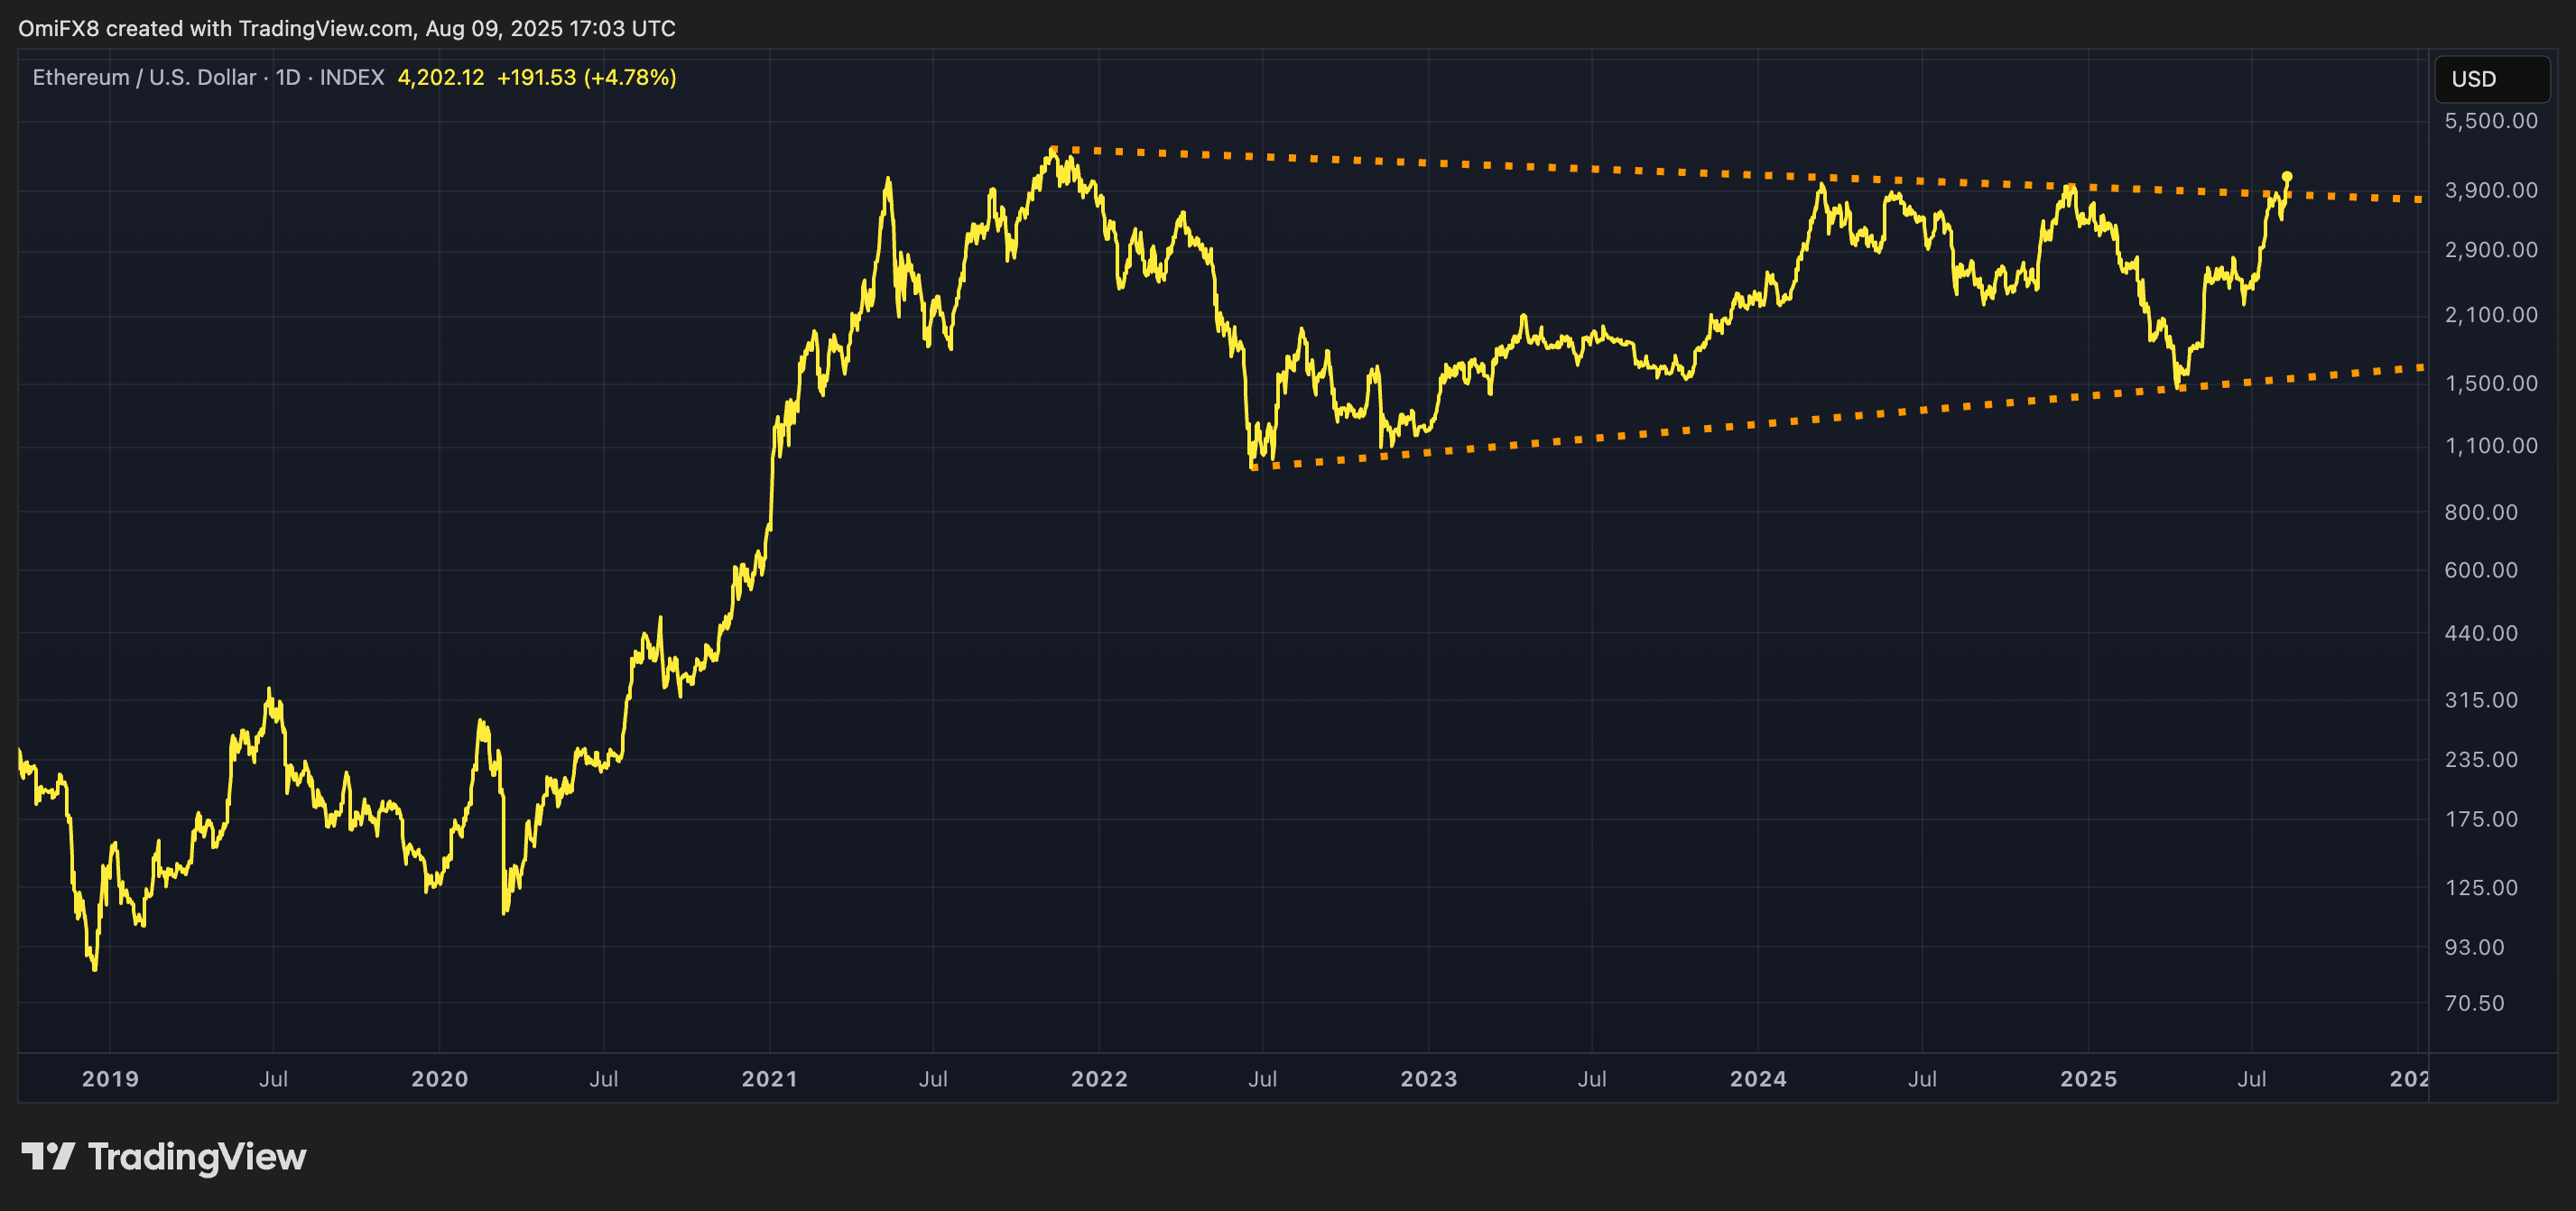
The decisive breakout, particularly on a chart with this long a time horizon, indicates that the market has officially entered a new, powerful uptrend, opening the door for a retest of record highs above $4,800.
- Resistance: $4,400, $4,875, $5,000.
- Support: $4,000, $3,941, $3,737.
