Bitcoin’s Bollinger Bands Squeeze Tightest Since February—Is a Mega Move Coming? XRP & SOL Struggle to Hold Ground

Crypto markets are coiled like a spring—Bitcoin’s Bollinger Bands haven’t been this tight since February, signaling potential volatility ahead. Meanwhile, XRP and SOL keep painting lower highs, leaving traders wondering if the altseason spark has fizzled.
### The Bitcoin Squeeze Play
When Bollinger Bands narrow, big moves follow. Bitcoin’s current compression mirrors February’s setup—just before a 20% monthly rally. But this isn’t your grandma’s symmetrical triangle; the king crypto’s playing chicken with traders who still think ‘low time preference’ means checking charts once per earnings season.
### Altcoins: Lower Highs, Lower Conviction
XRP and SOL keep bumping their heads on descending resistance like overzealous interns at a glass ceiling. Solana’s ‘Ethereum killer’ narrative? More like ‘Ethereum’s mildly annoying cousin’ these days. And XRP—well, at least the lawyers are getting paid.
### The Cynic’s Corner
Wall Street’s still waiting for that ‘institutional tsunami’ to justify their crypto desks. Meanwhile, retail traders out here treating TA like horoscopes—if you squint hard enough, any chart pattern confirms your bias.
Buckle up. When bands this tight finally snap, someone’s getting liquidated—and your Twitter feed will be insufferable either way.
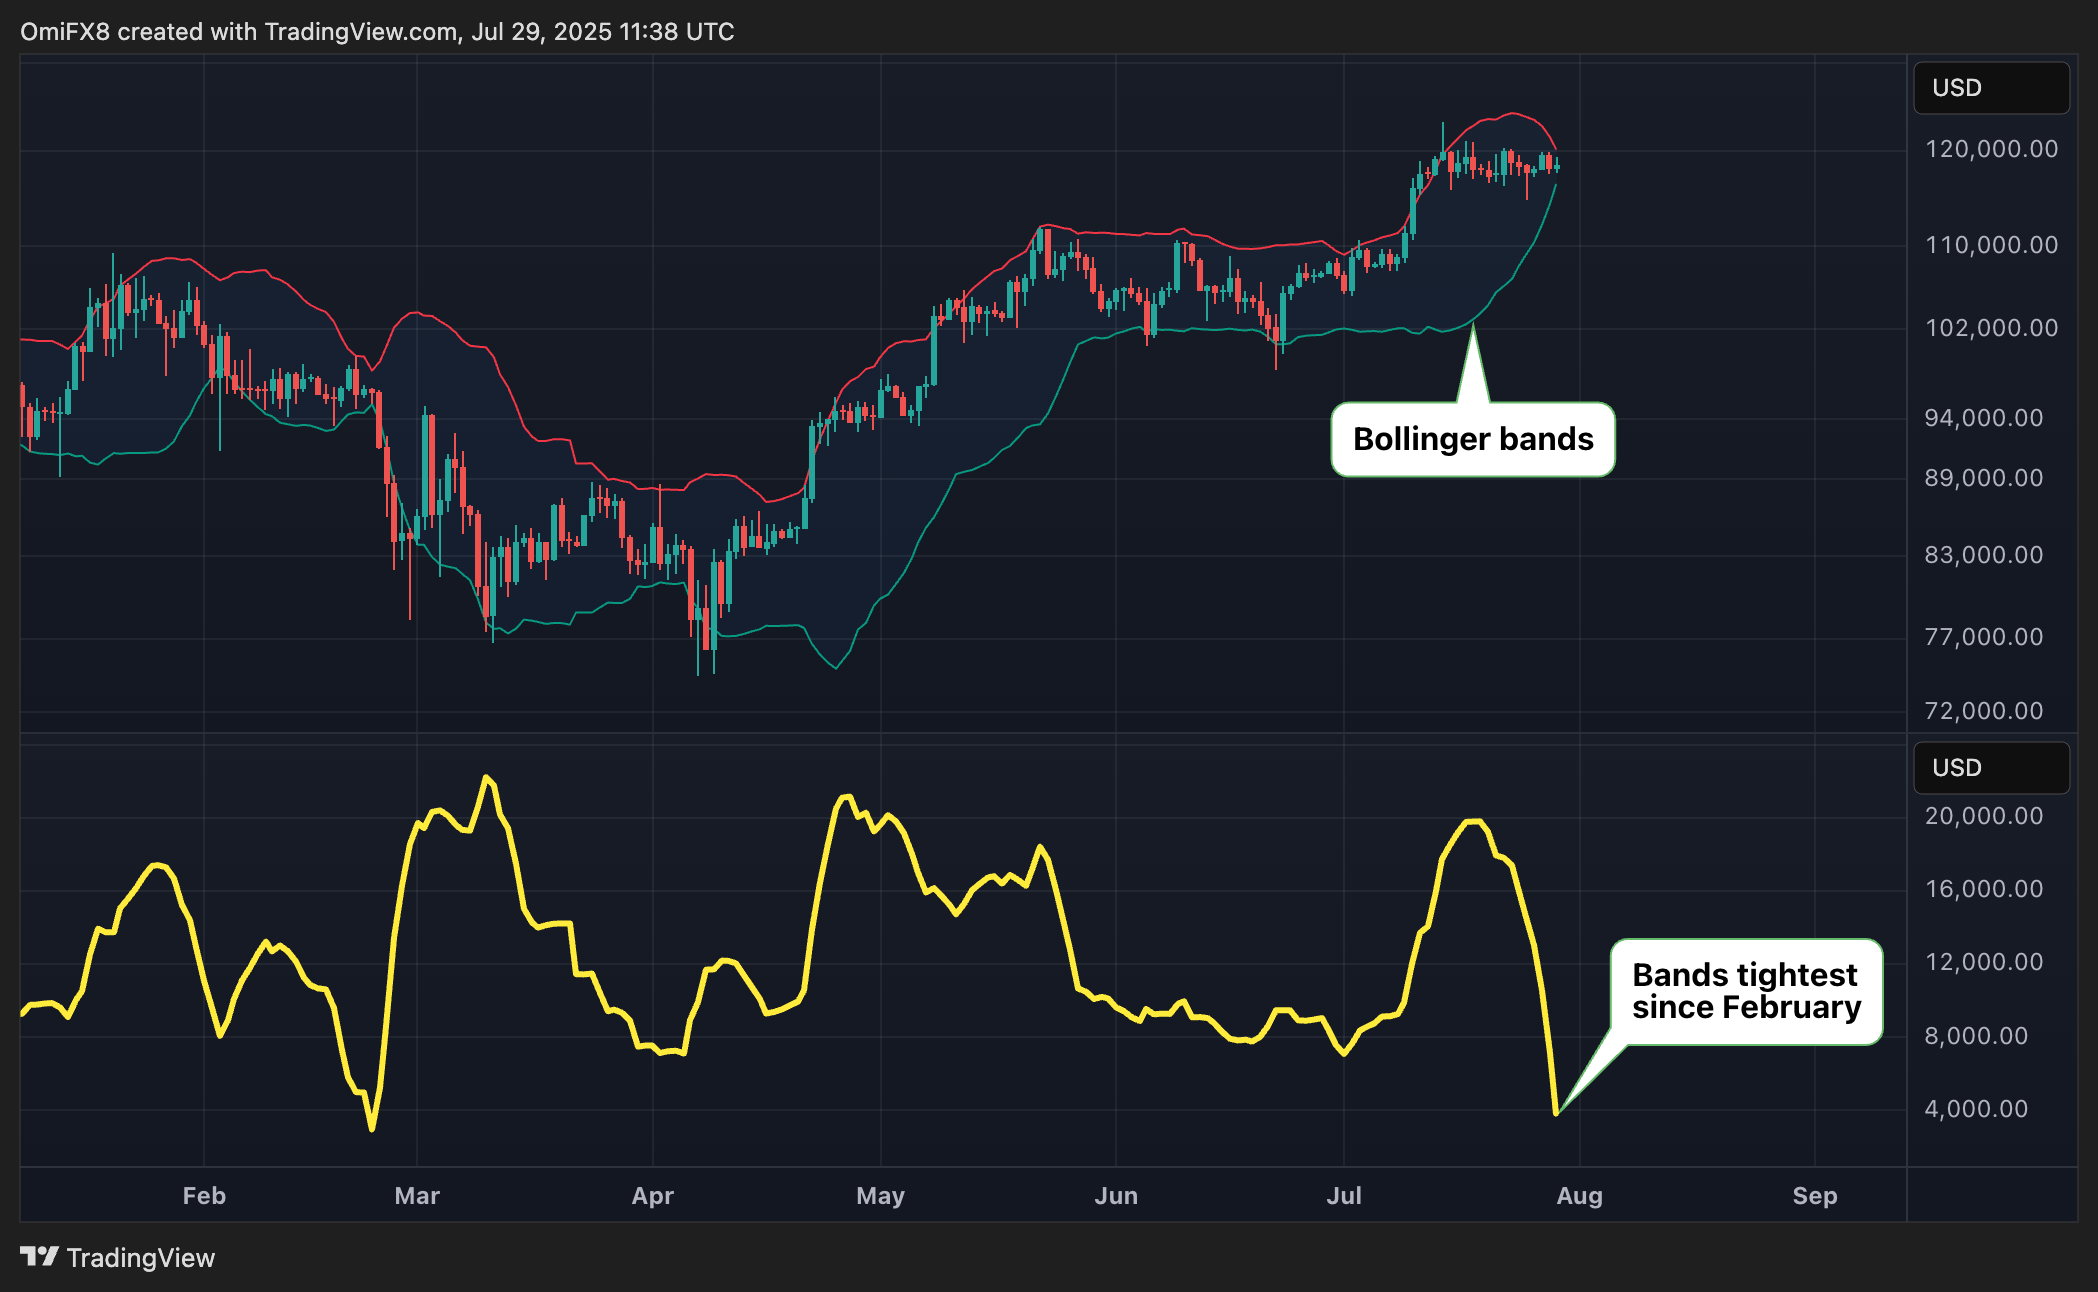
Bitcoin: Bollinger bands tighten
BTC's continued consolidation between $116,000 and $120,000 calls for renewed focus on Bollinger bands, which have now tightened to levels last seen before the late February volatility explosion that saw prices drop from $95,000 to $80,000 within days.
Tighter bands indicate that the market is coiling up and building energy for a big MOVE in either direction. Bollinger bands are volatility bands placed two standard deviations above and below the asset's 20-day simple moving average.
This view is consistent with the VIX's bullish August seasonality that suggests heightened price turbulence for stocks and Bitcoin over the coming four weeks.
A break below $116,000 WOULD imply downside volatility explosion, exposing the former resistance-turned-support at $111,965. Conversely, a quick move to new lifetime highs appears likely if tighter Bollinger bands resolve bullishly.
- AI's take: The significant contraction of volatility, especially after a strong uptrend, often signals that the price is coiling up for a large and potentially explosive move in the near future.
- Resistance: $120,000, $123,181.
- Support: $116,000-$117,000, $114,700, $111,965.
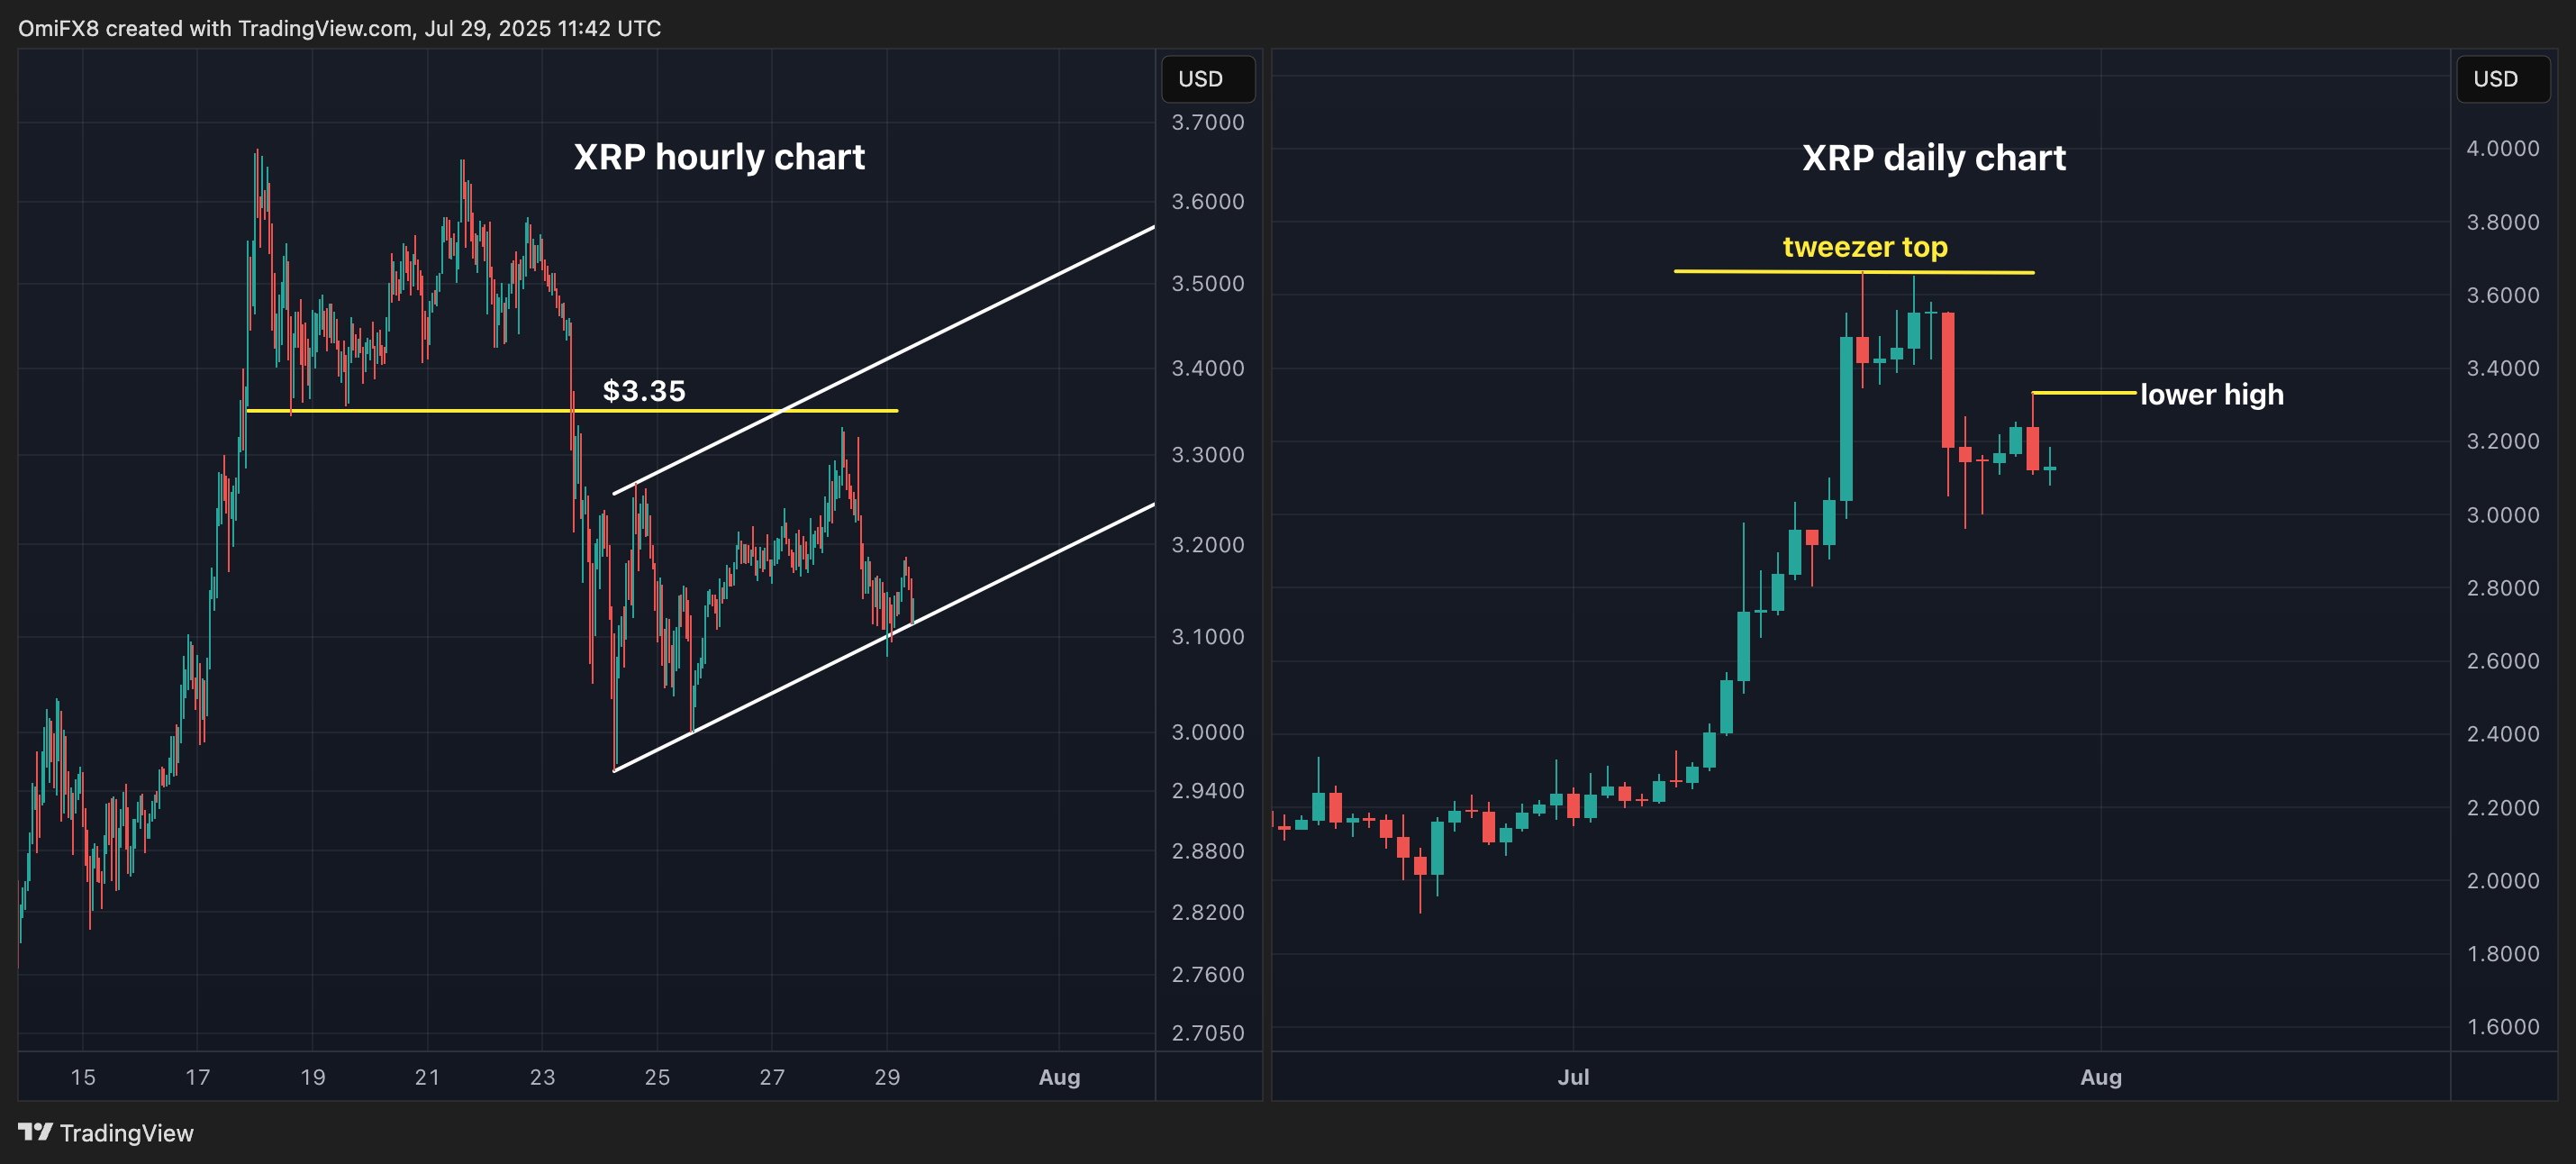
XRP: Lower high established
XRP fell 3.59% on Monday, creating a red candle with a prominent upper wick, suggesting seller dominance. The cryptocurrency printed a lower high at $3.33, the first since peaking at $3.65 with a bearish tweezer top pattern, indicating a potential deeper pullback ahead. This suggests that it's only a matter of time before the mini-ascending channel seen on the hourly chart gives way, exposing the recent low of $2.95 and possibly the May high of $2.65. The hurdle at $3.35 must be overcome to negate the bearish bias.
- AI's take: Traders should primarily focus on whether XRP can decisively reclaim and hold above the crucial $3.35 level, which now acts as immediate resistance. A failure to do so would reinforce the daily chart's bearish reversal signals (tweezer top, lower high), suggesting further downside,
- Resistance: $3.35, $3.65, $4.00.
- Support: $2.95, $2.65, $2.44 (the 200-day SMA).
Ether: RSI diverging bearishly
Ether's 14-day relative strength index (RSI) has diverged bearishly from the price, with the MACD histogram nearing a negative crossover confirmation. These developments suggest a potential pullback to the higher low of $3,510 registered on July 24. A violation there could extend the pullback toward $3,000.
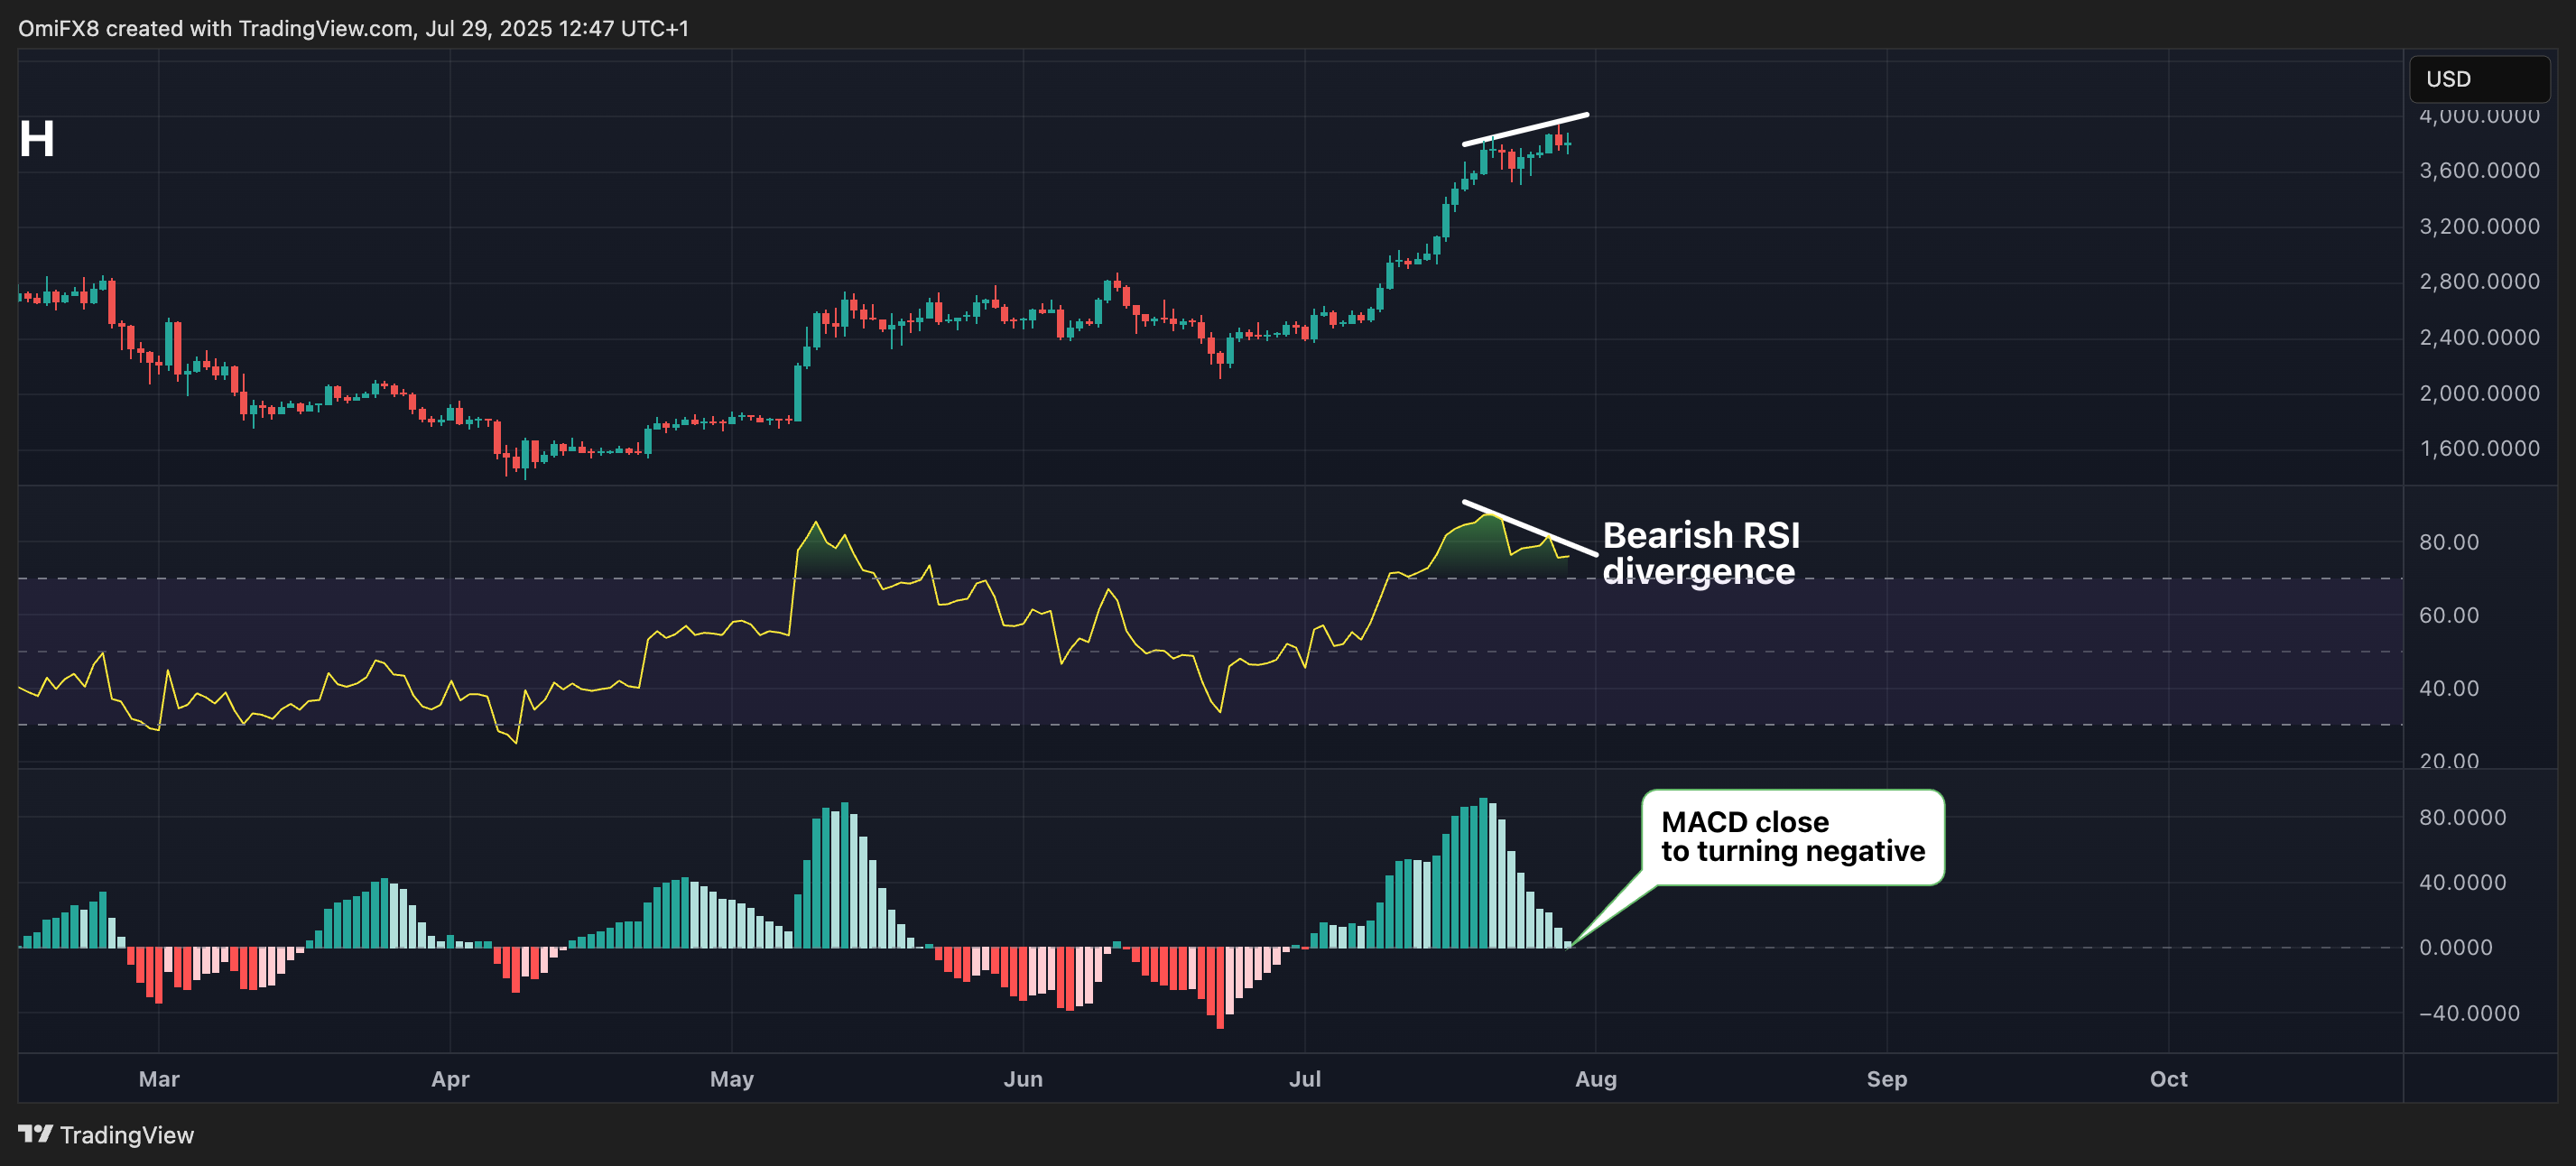
- AI's take: Traders should primarily focus on the bearish divergence displayed by the RSI, which signals weakening momentum despite Ether's recent price high.
- Resistance: $4,000, $4100, $4,382.
- Support: $3,731 (daily low), $3,510, $3,000.
Solana: XRP-like structure
SOL established a lower high at $195, reinforcing the bearish tweezer top pattern at $205-$206. Additionally, the cryptocurrency has dived out of a mini-ascending channel and the Ichimoku cloud on the hourly chart, suggesting the path of least resistance is to the downside. The resistance at $195 needs to be topped to invalidate the bearish bias.
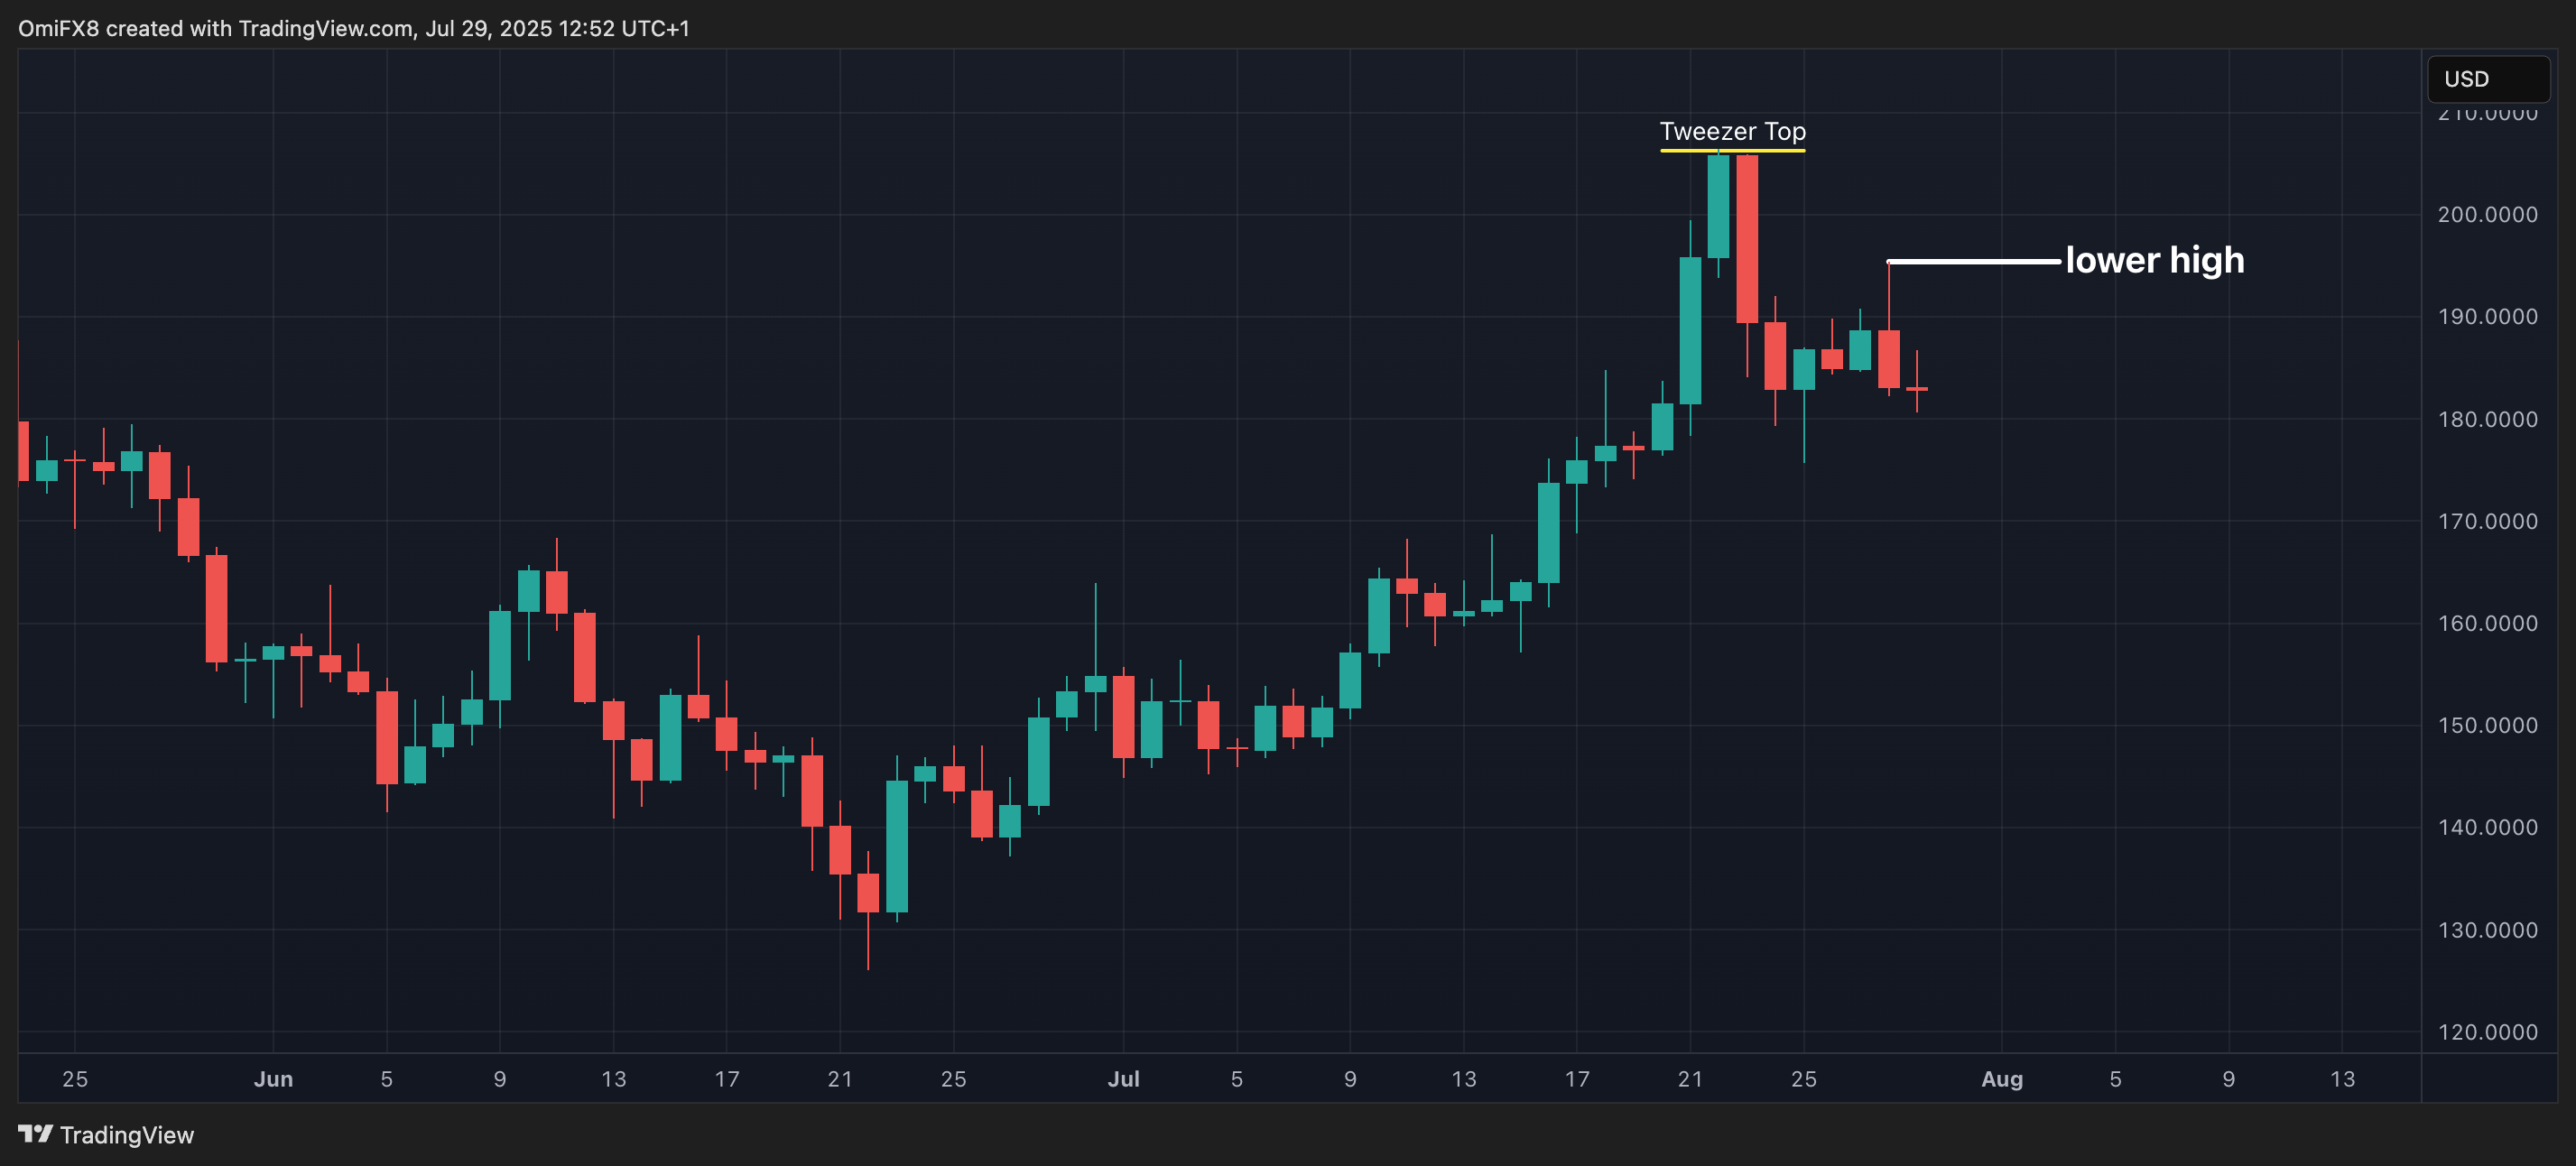
- AI's take: "Tweezer Top" candlestick pattern at the peak of the rally, immediately followed by the formation of a "lower high" is a powerful bearish reversal pattern, indicating that the strong upward momentum from July has likely ended
- Resistance: $195, $205-$206, $218.
- Support: $184, $163, $126.
