Bitcoin’s Bullish Momentum Hits a Wall – Is the Rally Running on Empty?

Bitcoin's relentless surge is showing cracks. After months of parabolic gains, the king of crypto appears to be gasping for air—technical indicators scream exhaustion as buyers retreat.
The fatigue is real. No fancy metrics needed—just watch the weakening volume and failed breakout attempts. Even the most hardened crypto bulls are tapping the brakes.
Meanwhile, traditional finance suits cluck about 'I told you so' moments between sips of overpriced lattes. But let's be real—they've missed every major crypto boom since 2013.
What's next? Either fresh capital rushes in to prop up the rally, or we're staring down a textbook correction. One thing's certain: Bitcoin never does anything quietly.
Bitcoin: Correction risks mount
Bitcoin (BTC) continues to trade directionless NEAR $120,000 amid data from the Deribit-listed options showing a significant positive dealer gamma at the $120,000 and $120,500 strikes. When dealers have a positive gamma exposure, they buy low and sell high to rebalance their net exposure to neutral, inadvertently arresting volatility.
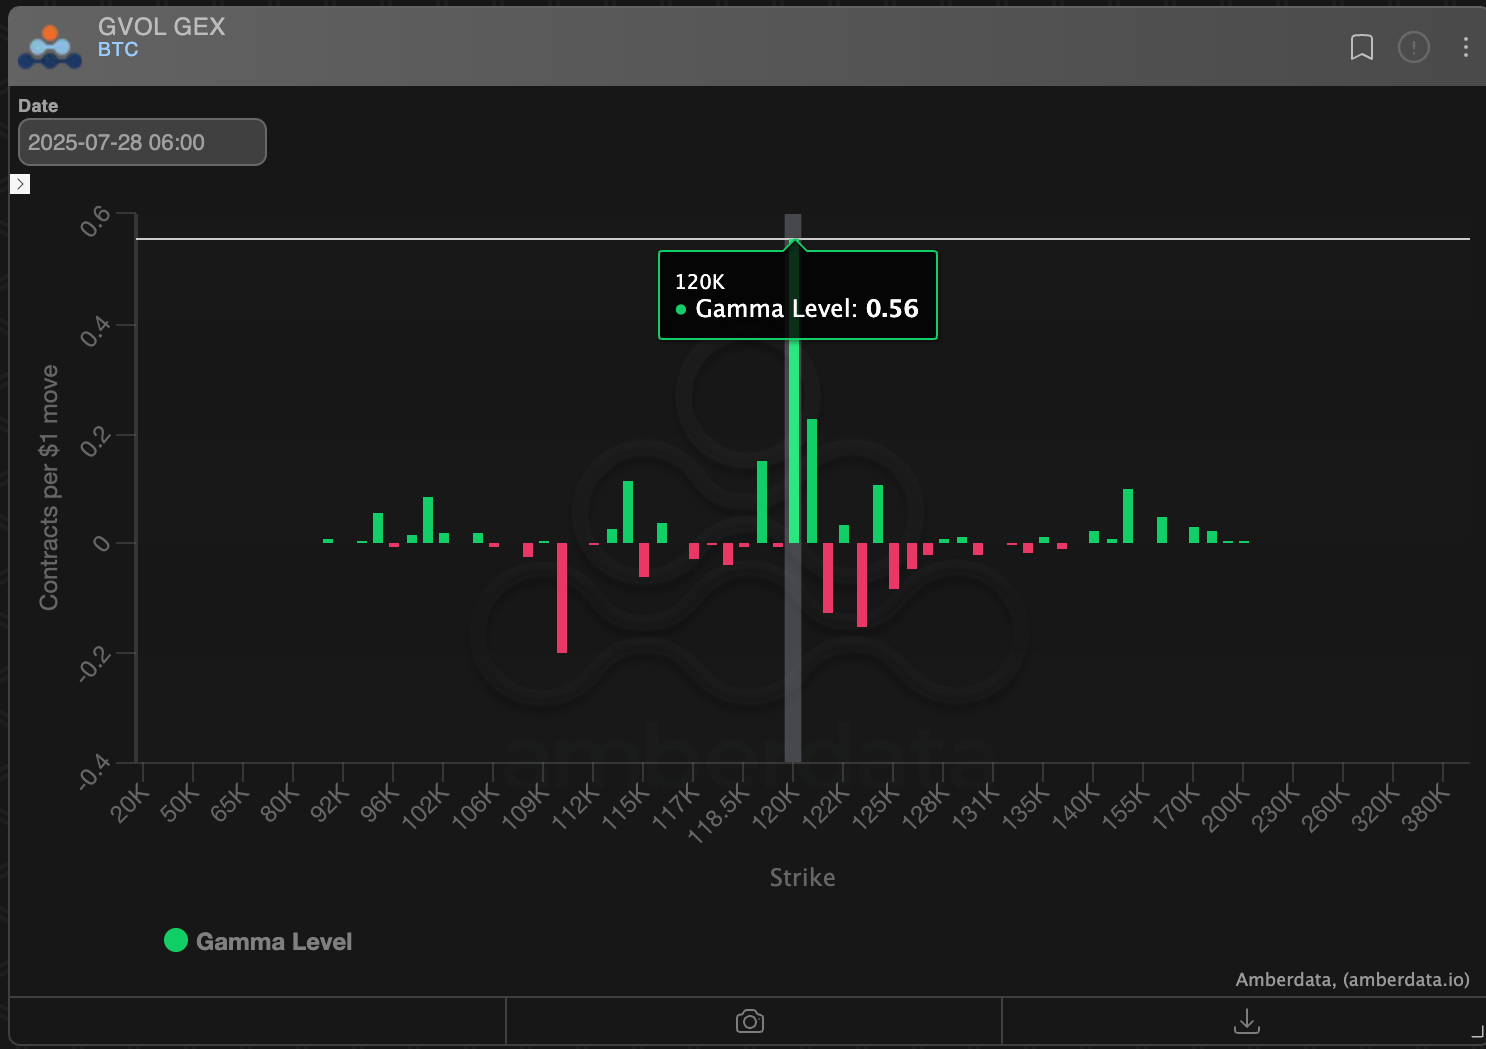
The crucial support area between $116,000 and $117,000, validated by both price charts and on-chain activity, if breached, WOULD likely pave the way for a retest of the May high just below $112,000. Conversely, a convincing move above $120,000 will likely bring record highs.
That said, the case for an extended pullback looks strong, as the miniscule 0.12% green bar, confirmed on July 22 on the three-line break chart with daily configuration, indicates uptrend exhaustion.
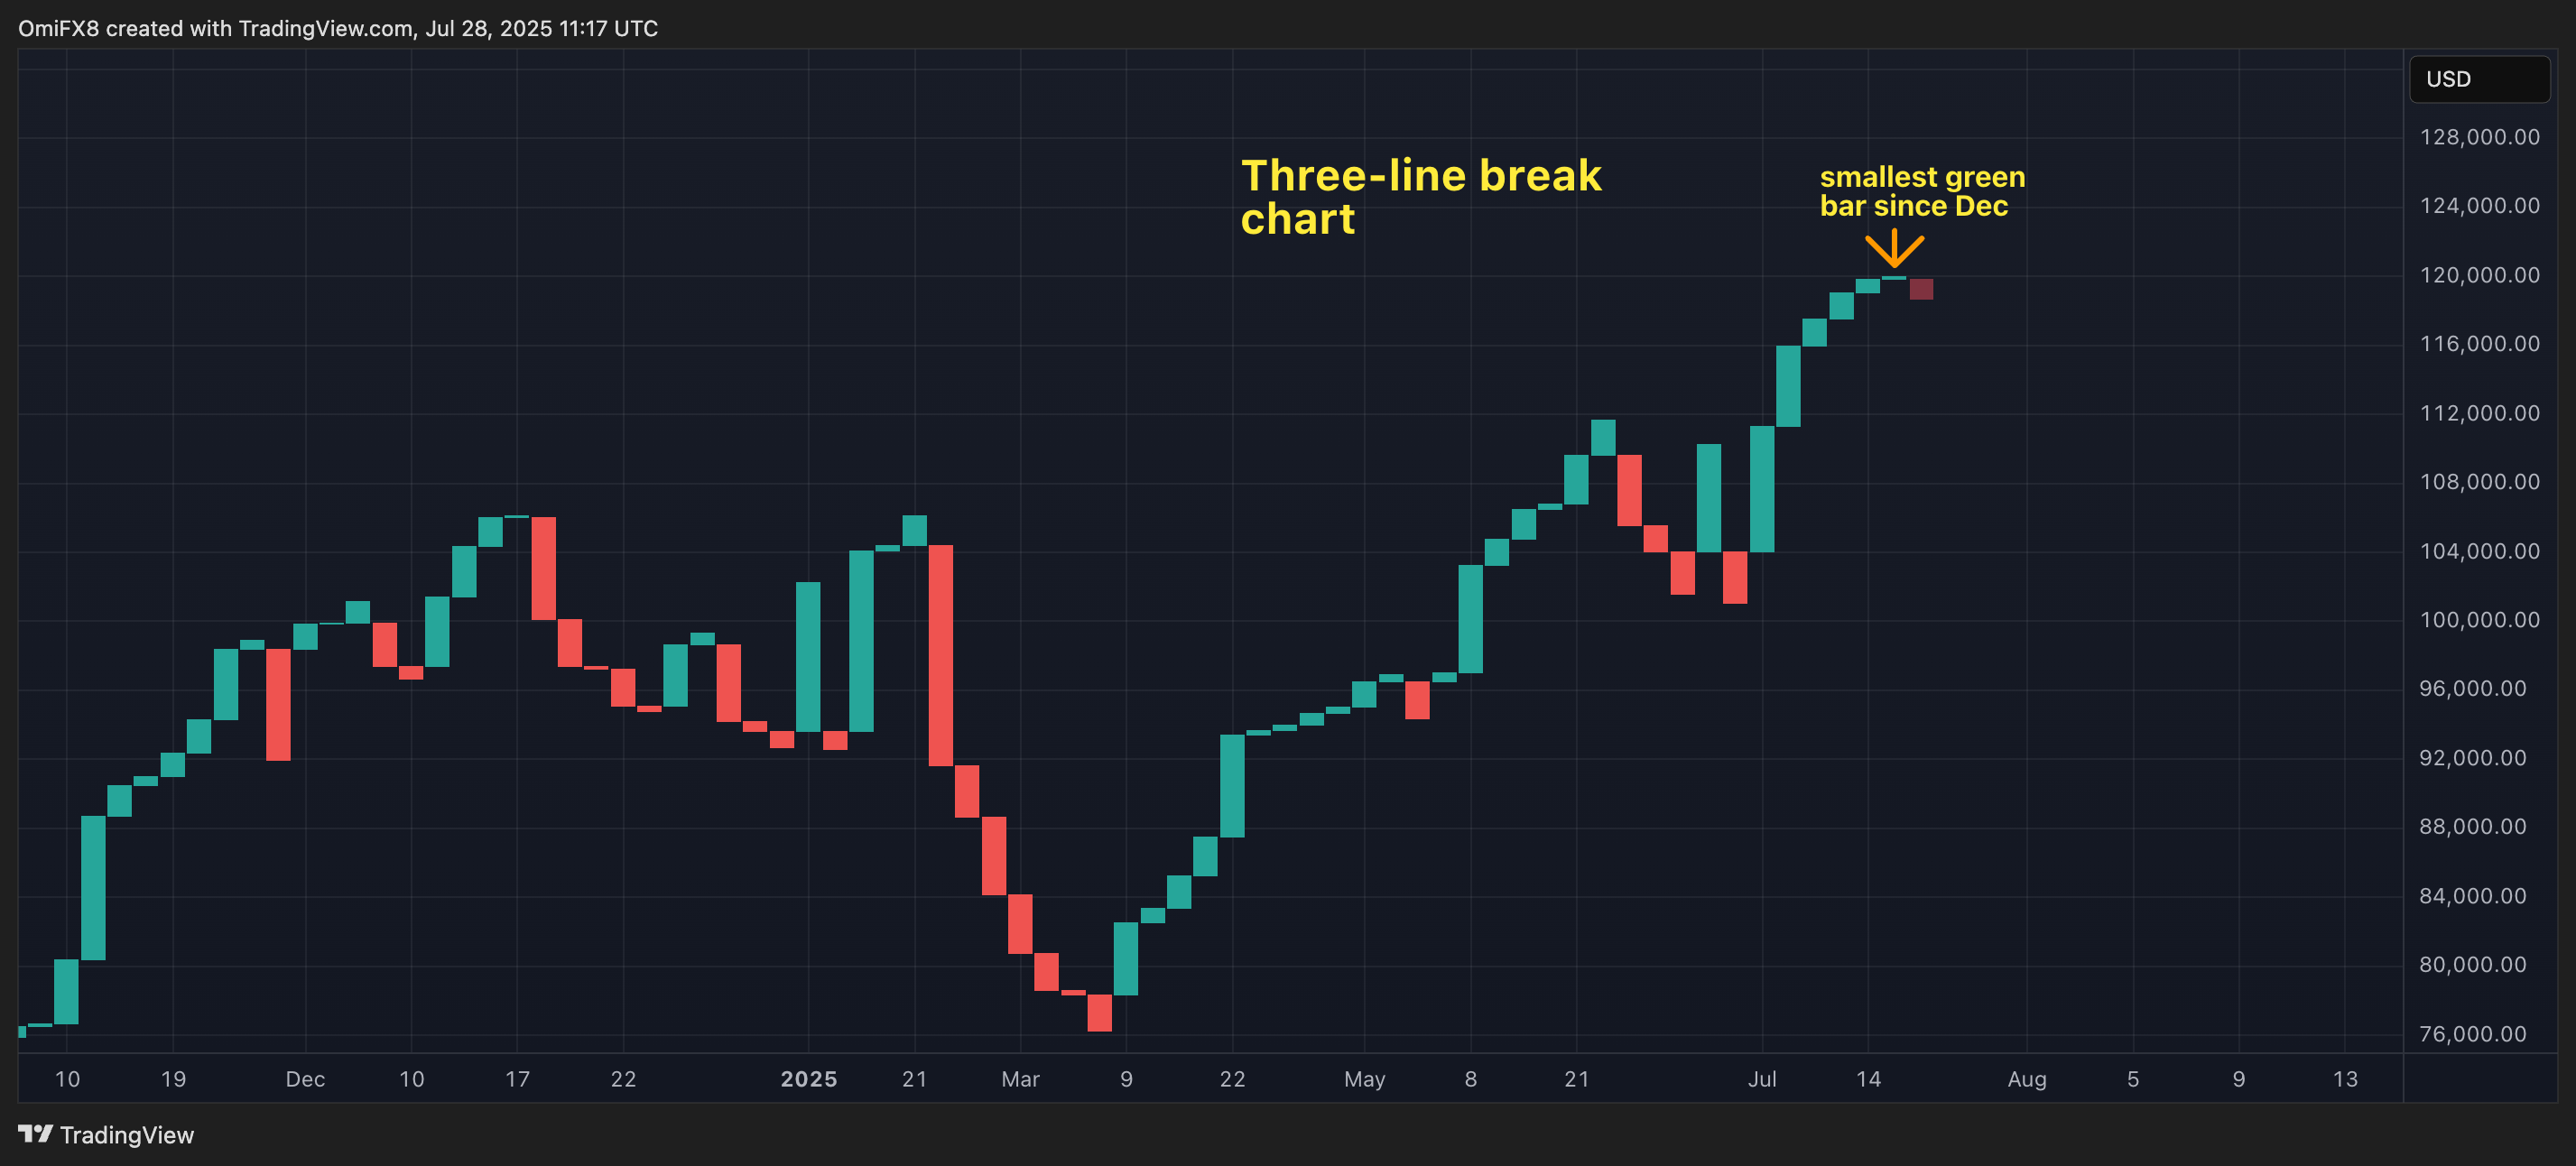
- AI's take: On a three-line break chart, where each bar signals a confirmed trend move, the minuscule 0.12% green bar on July 22 is a significant warning. It indicates that the strong uptrend is experiencing severe exhaustion of buying momentum, suggesting a potential imminent consolidation or reversal despite the overall bullish trend.
- Resistance: $120,000, $123,181.
- Support: $116,000-$117,000, $114,700, $111,965.
Ether: Hits 7-Month
Ether (ETH) has risen nearly 2% in the past 24 hours, hitting a seven-month high of $3,937 at one point, which invalidated the indecisive Doji signal from last week.
The momentum, however, was short-lived, as prices quickly pulled back to $3,880 as of the time of writing, validating the 14-day RSI, which did not confirm the fresh multi-month high in prices, hinting at potential bearish divergence and an impending correction. The daily chart MACD histogram also teased a bearish cross, with on-chain fundamentals like Ethereum's native fees and revenue failing to keep pace with the rising prices.

The higher low of $3,510 established on Thursday remains key support, below which, the risk of an extended slide would increase. On the higher side, the $3,900-$4,100 is the key resistance range from 2024.
- AI's take: The MACD is flashing an impending negative cross, signaling weakening bullish momentum, while the RSI shows bearish divergence, failing to confirm new price highs. These indicators collectively point to a loss of upward thrust, increasing downside risk.
- Resistance: $4,000, $4100, $4,382.
- Support: $3,770 (daily low), $3,510, $3,000.
XRP: Retreats from support-turned-resistance
XRP (XRP) has reversed the gains from the Asian session, retreating from near the former support-turned-resistance level at $3.35. The pullback appears to have legs, as the hourly chart's RSI has violated the bullish trendline and the MACD histogram has crossed below zero, signaling a bearish shift in momentum.
This structure favors a retest of the July 24 low of $2.96, below which, the focus would shift to the May high of $2.65.
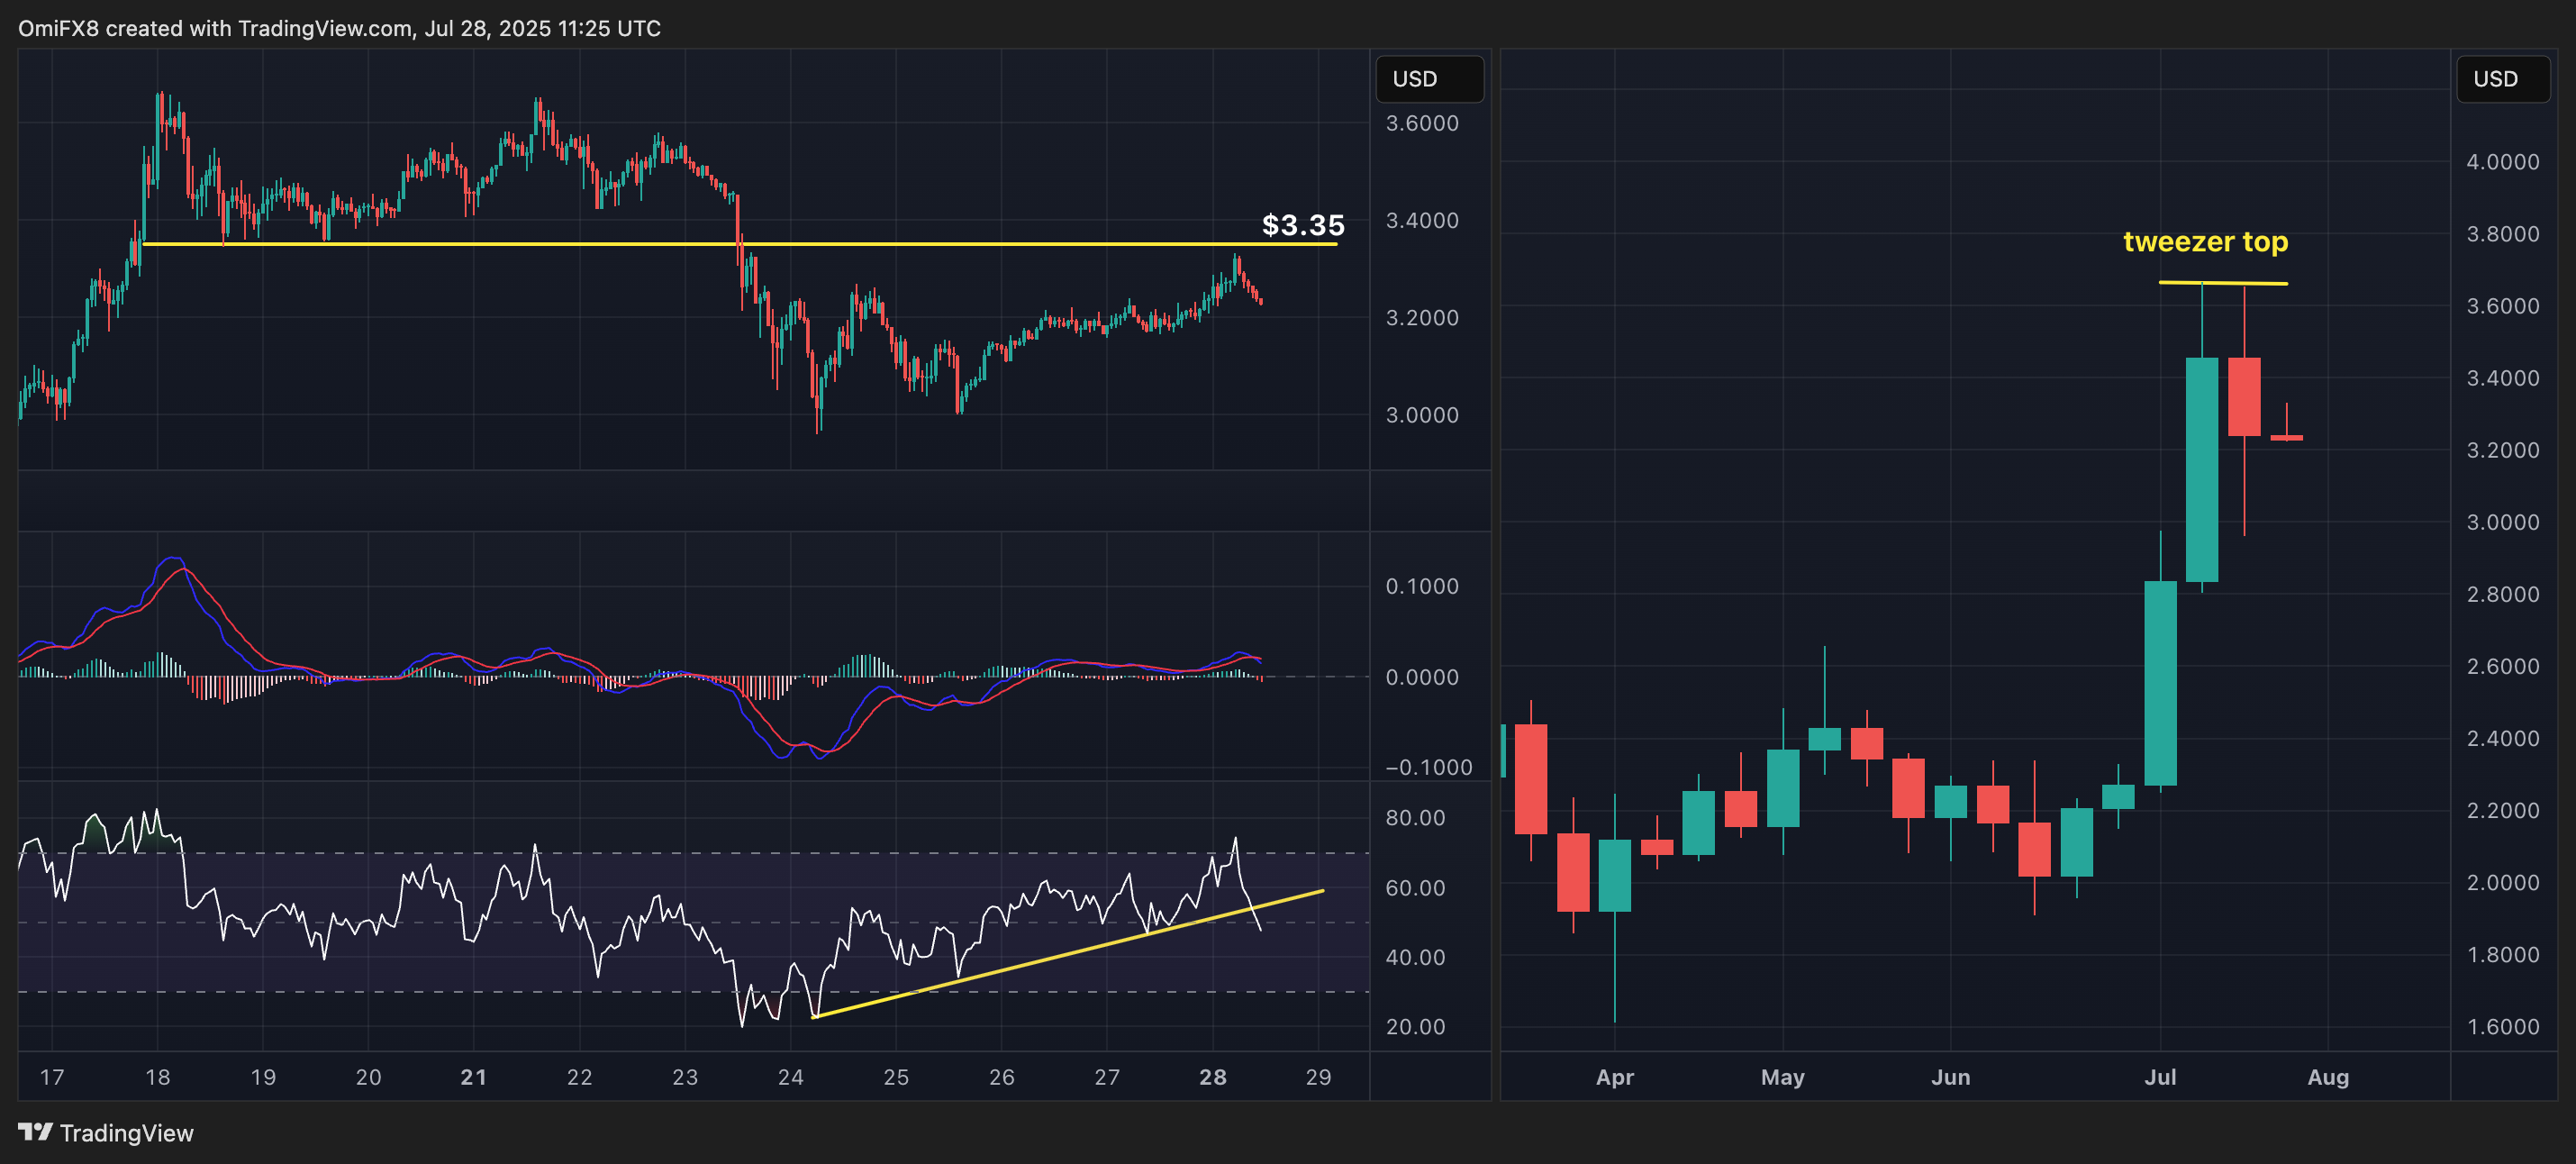
The tweezer top pattern on the weekly chart, characterized by consecutive candlesticks with highs at $3.65, also suggests a bearish shift in momentum.
- AI's take: XRP's impressive rally has been capped by a significant "tweezer top" candlestick pattern, a strong bearish reversal signal that warns of potential downside from its multi-year highs.
- Resistance: $3.35, $3.65, $4.00.
- Support: $2.96, $2.65, $2.44 (the 200-day SMA)
Solana: Not out of the woods yet
SOL's (SOL) price has recovered to trade above the hourly chart Ichimoku cloud, establishing higher lows to suggest renewed upward momentum and a possible retest of $200, the upper end of the ascending channel.
Still, we are not out of the woods yet, as the tweezer top formation at $205-$206 on the daily chart remains valid. Hence, a MOVE below $184, the higher low, cannot be ruled out and will likely lead to an accelerated pullback to the 200-day SMA at $163.
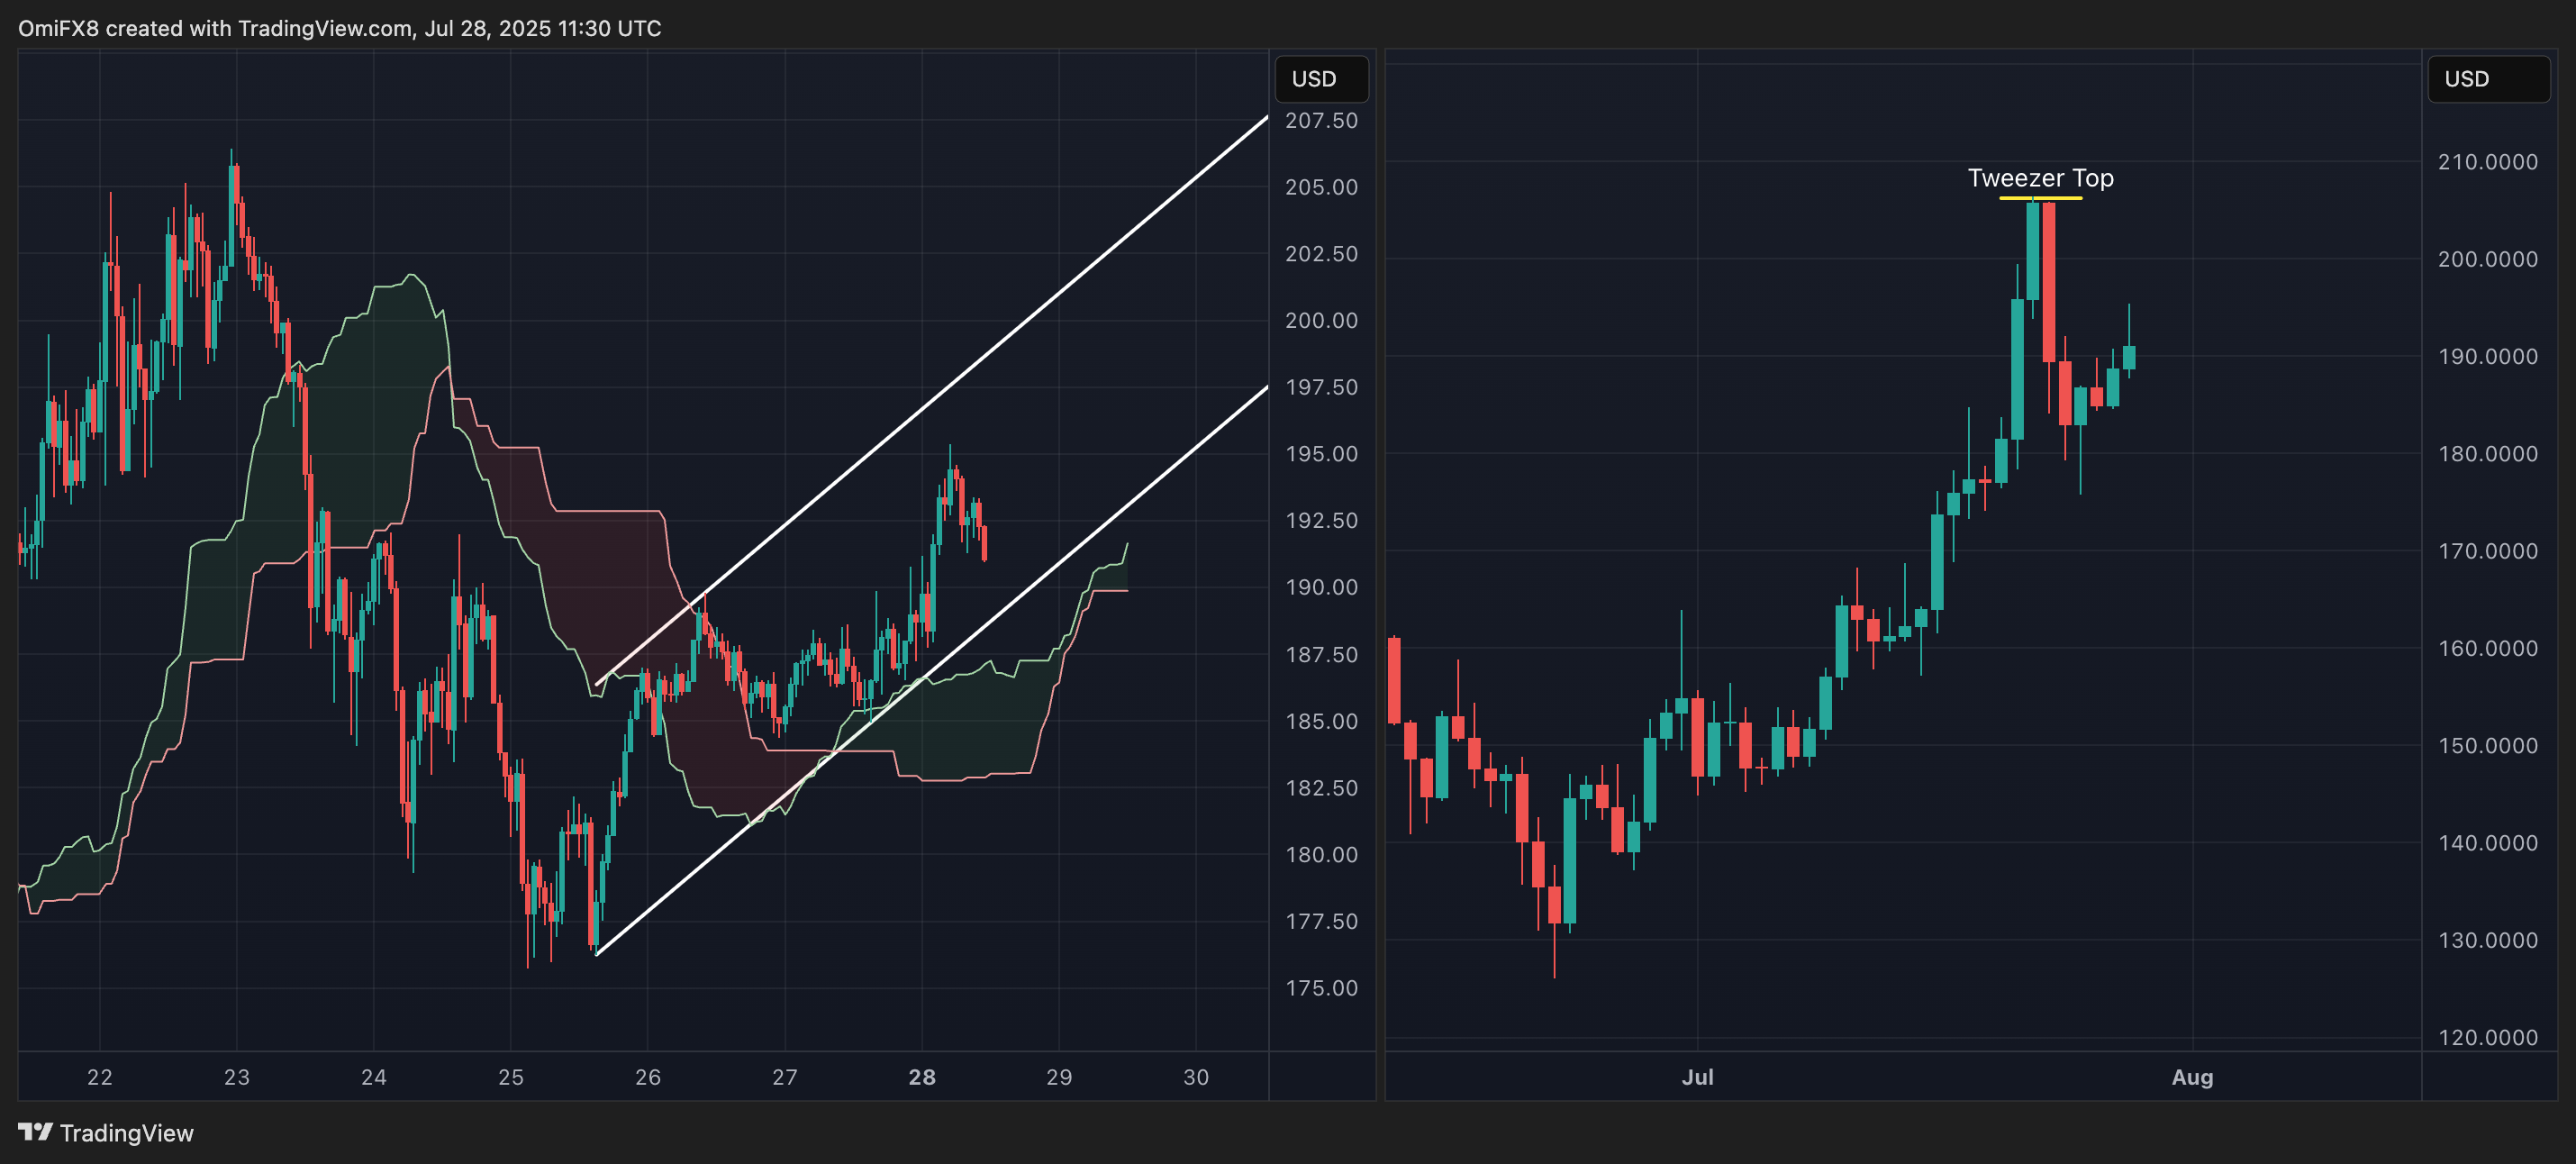
- AI's take: Solana's impressive July rally has produced a "Tweezer Top" candlestick pattern at its peak, signaling a strong bearish reversal that suggests significant selling pressure has entered the market.
- Resistance: $205-$206, $218, $252.
- Support: $184, $163, $126.
